 Self Wealth Management
Investing Academy
A financial Sat Nav, not a financial driver. Chapters that explain how investing works — the roads, the risks, the trade-offs — so you can decide where to go.
Why Invest?
Investing gives your money the opportunity to grow faster than inflation over the long term.
Investing is simply giving your money the opportunity to grow over time.
Unlike cash, investments rise and fall in value. That uncertainty can feel uncomfortable, but history suggests patient, long-term investors have often been rewarded for accepting it.
The aim isn't to predict the market or get rich quickly. It's to help your money grow faster than inflation over the long term.
Why not just keep everything in cash?
Cash is important. It's generally the right place for emergency savings and money you'll need over the next few years.
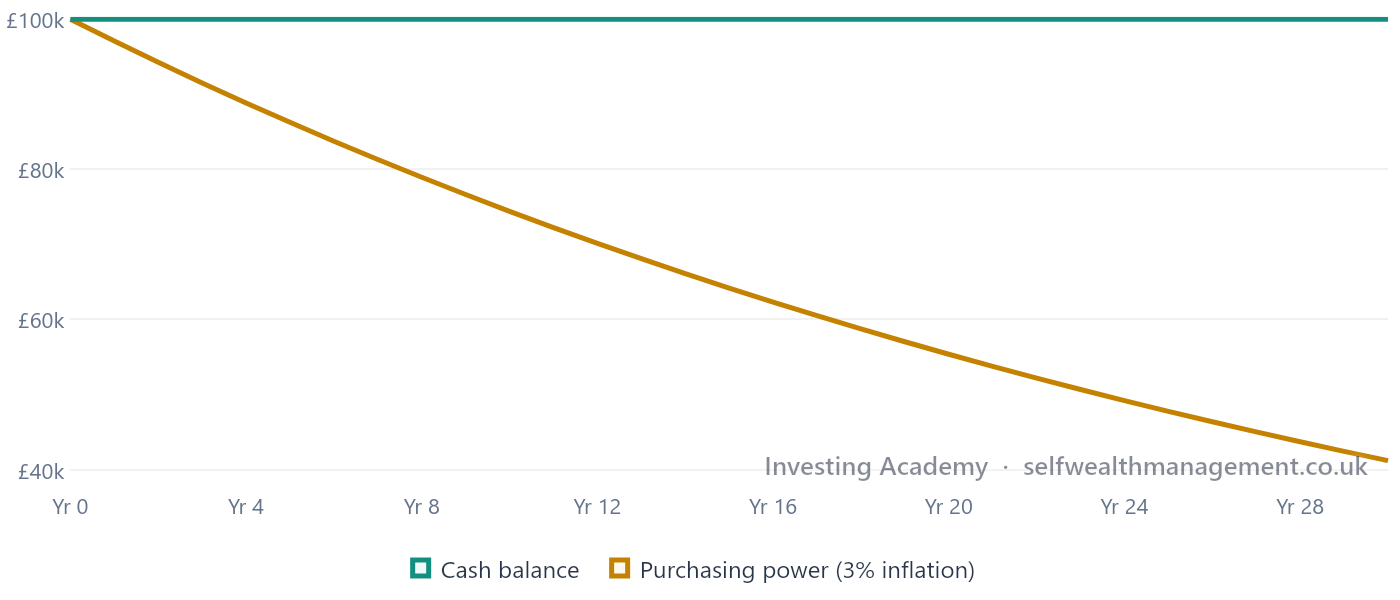
The challenge is inflation. As prices rise, the spending power of your money gradually falls. Even if your savings account is growing, it may not be growing fast enough to keep pace with rising prices.
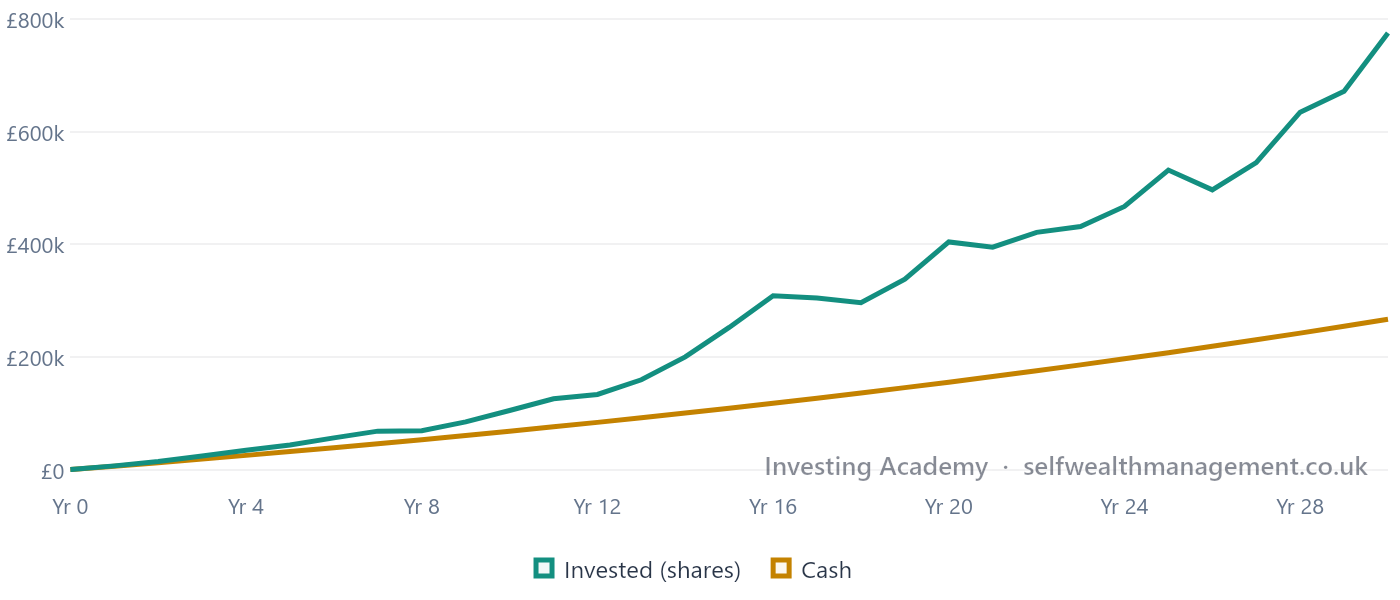
Over long periods, history suggests investments such as shares have generally outperformed both inflation and cash, although they have also experienced much greater ups and downs.
The trade-off
Every investing decision involves balancing stability against growth.
| Cash | Investing |
|---|---|
| Value is generally stable | Values rise and fall |
| Suitable for short-term goals | Designed for long-term goals |
| Easy access | Best suited to money you won't need for several years |
| Inflation can reduce purchasing power | Historically offered better protection against inflation |
Neither is better, and most people need both.
Time is one of your biggest advantages
Markets rarely move in a straight line. There will always be periods when prices fall. Sometimes those falls are sharp and uncomfortable.
The longer money remains invested, the more opportunity it has historically had to recover from market declines and benefit from compound growth.
This is why investing is generally considered more suitable for long-term goals than short-term spending.
Is investing right for everyone?
Not necessarily. Money needed in the near future is often better held in cash, where short-term market movements are less likely to affect it.
Investing is generally more appropriate for money that can remain untouched for many years. Your goals, time horizon, attitude to risk and ability to absorb losses all matter.
Many of the stock market's strongest days have occurred shortly after some of its weakest. That's one reason why trying to time the market has historically been so difficult.
- Investing aims to grow your money over the long term.
- Cash is generally more suitable for short-term spending and emergency savings.
- Inflation can reduce the purchasing power of cash over time.
- Historically, investments such as shares have produced higher long-term returns than cash, but with greater short-term volatility.
Educational disclaimer: This information is for educational purposes only and should not be considered financial advice or a recommendation. Investments can fall as well as rise in value, and you may get back less than you invest. Past performance is not a reliable indicator of future results.
Inflation
Inflation is the gradual rise in prices that quietly erodes what your money can buy.
Inflation is the gradual increase in the cost of goods and services over time.
Put simply, the same amount of money buys less than it used to. If something costs £100 today and inflation averages 3% a year, it would cost around £134 in ten years' time.
The amount of money hasn't changed, but what you can buy with it has.
Why does inflation matter?
Inflation affects everyone. If your savings don't grow as quickly as prices rise, your spending power gradually falls.
For example, imagine you leave £20,000 in a current account earning no interest. After ten years, you'll still have £20,000. But if prices have risen over that period, that £20,000 won't buy as much as it once did. This is known as a loss of purchasing power.
Inflation doesn't need to be high to matter
Small increases can have a surprisingly large effect over time.
| Average Inflation | Purchasing Power of £1 After 20 Years |
|---|---|
| 2% | Around 67p of today's spending power |
| 3% | Around 55p |
| 5% | Around 38p |
Inflation compounds just like investment returns do, but it generally works against you.
Inflation vs Investment Returns
Historically, shares have delivered returns above inflation over long periods. That doesn't mean they outperform every year. Some years, inflation is higher; some years, markets fall.
But over decades, history suggests diversified investments have generally offered a better chance of preserving and growing purchasing power than cash alone.
Can inflation ever be a good thing?
Low and stable inflation is generally considered healthy for an economy. It encourages spending and investment rather than people simply holding cash.
Very high inflation, however, can reduce living standards and create uncertainty for households and businesses.
In the mid-1970s, UK inflation peaked at around 25%, marking the fastest that prices have risen in modern British history. £100 kept as cash at the start of 1975 could buy only around £80 worth of goods a year later. Inflation eventually came back down, but the lesson stuck: money that grows slower than prices loses value.
What can we learn? Inflation may not feel as dramatic as a market crash, but over long periods it can have a significant impact on purchasing power.
- Inflation means prices rise over time.
- Inflation reduces the spending power of money.
- Cash can lose value in real terms even if the balance doesn't fall.
- Historically, investments have generally provided better protection against inflation over long periods than cash, although with greater risk.
Educational disclaimer: This information is for educational purposes only and should not be considered financial advice or a recommendation. Investments can fall as well as rise in value, and you may get back less than you invest. Past performance is not a reliable indicator of future results.
Compound Growth
Compound growth means your returns start generating returns of their own (and time is the key ingredient).
Compound growth is often described as one of the most powerful concepts in investing.
It simply means your investment returns begin generating returns of their own. Instead of earning growth only on the money you invest, you also earn growth on previous gains. Over long periods, this can make an enormous difference.
Why starting early matters
Time is the key ingredient. The longer your money remains invested, the longer compound growth has to work. Starting earlier often has a greater impact than investing larger amounts later.
Example
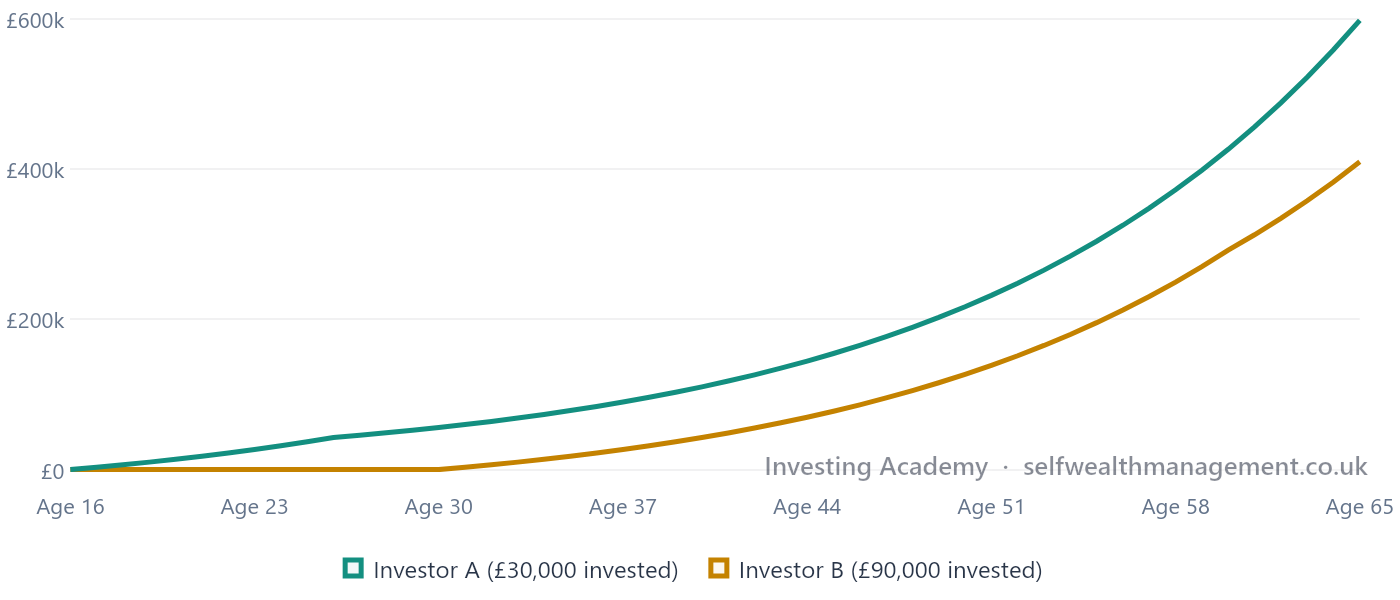
Investor A invests £250 per month from age 16 to 26, then never contributes another penny. Total invested: £30,000.
Investor B waits until age 30 and invests £250 per month until age 60. Total invested: £90,000.
| Investor | Total Invested | Value at 65* |
|---|---|---|
| Investor A | £30,000 | ~£598,000 |
| Investor B | £90,000 | ~£410,000 |
*Illustrative example assuming 7% constant annual growth. Not a forecast.
Investor A invested one-third as much money but finished with more, because their investments had longer to grow.
Consistency matters
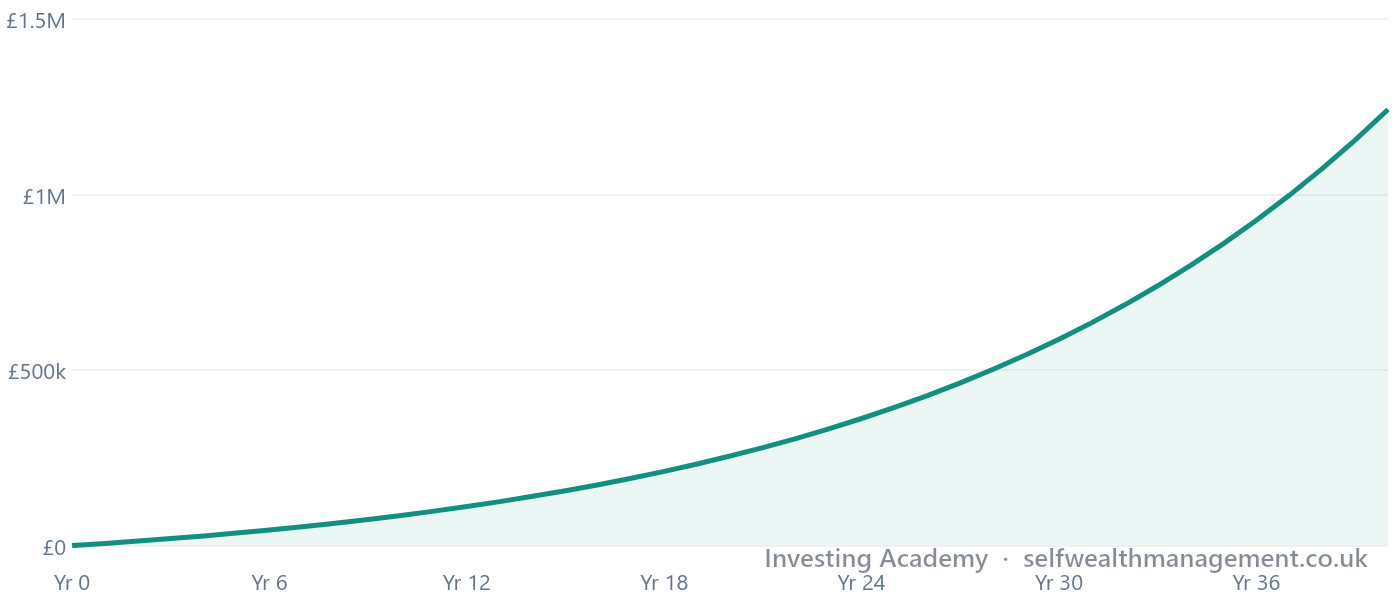
You don't need to invest large sums to benefit from compound growth. Regular monthly investing can build significant wealth over time.
| Monthly Investment | 10 Years | 20 Years | 30 Years |
|---|---|---|---|
| £250 | ~£43,000 | ~£127,000 | ~£292,000 |
| £500 | ~£86,000 | ~£254,000 | ~£585,000 |
| £1,000 | ~£171,000 | ~£508,000 | ~£1.17 million |
Assumes 7% annual growth. Illustrative only.
Albert Einstein is often credited with saying: "Compound interest is the eighth wonder of the world. He who understands it, earns it; he who doesn't, pays it." There's little evidence he actually said this, but the quote didn't need Einstein's name to be true; the principle remains one of the most powerful forces in long-term investing.
- Compound growth means returns generate further returns.
- Time is one of the biggest contributors to long-term investment growth.
- Starting early can matter more than investing larger amounts later.
- Consistency is often more important than trying to time the market.
Educational disclaimer: This information is for educational purposes only and should not be considered financial advice or a recommendation. Investments can fall as well as rise in value, and you may get back less than you invest. Past performance is not a reliable indicator of future results.
What is Cash?
Cash gives you certainty. Its job isn't to generate high returns; it's to be there when you need it.
Unlike investments, cash doesn't normally rise and fall in value from day to day. That's why it's often seen as one of the lowest-risk places to keep your money. Cash has an important role in almost every financial plan.
What cash is for
Cash gives you certainty. If you know you'll need money in the near future, you probably don't want to risk its value falling just before you need it.
Cash is commonly used for:
- Emergency funds
- Holidays
- House deposits
- Car purchases
- School fees
- Planned spending over the next few years
The purpose of cash isn't to generate high returns. Its job is to be there when you need it.
Cash isn't risk-free
Although your account balance is generally stable, cash still carries risks. The biggest is inflation. If inflation is higher than the interest you're earning, your money is losing purchasing power.
There's also the risk of missing long-term growth if too much money remains in cash for decades.
When has cash historically outperformed shares?
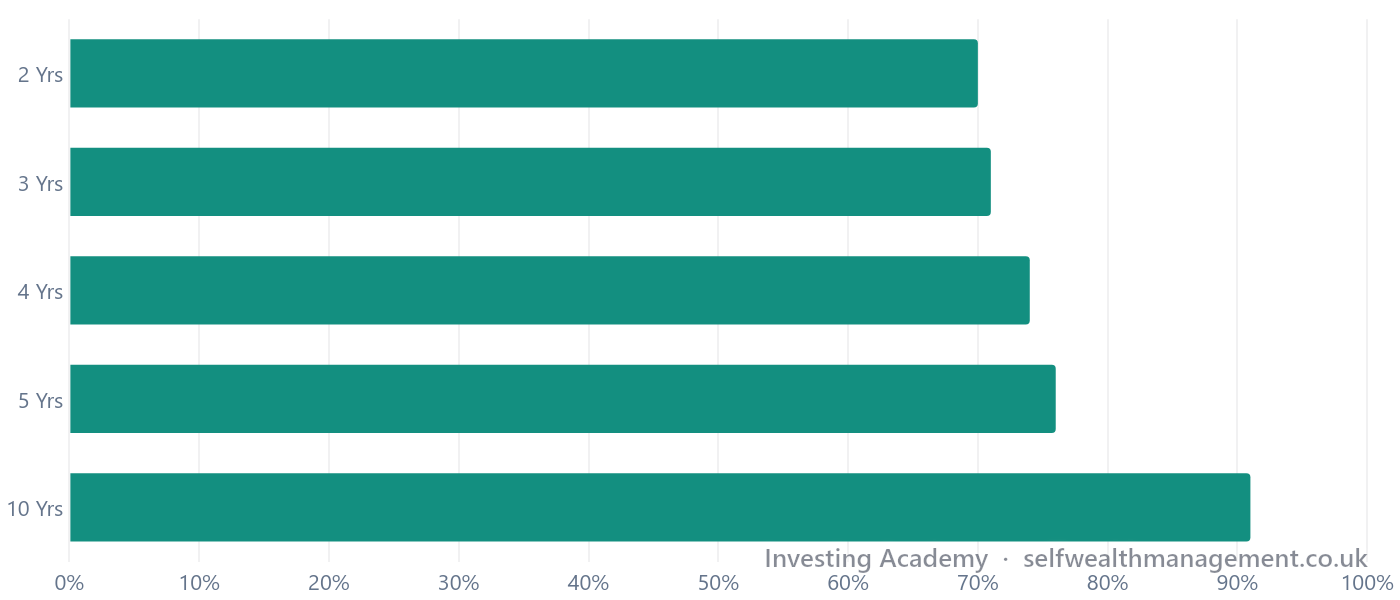
Cash has often outperformed shares over short periods. This is because share prices can fall sharply during market downturns, while cash generally remains stable.
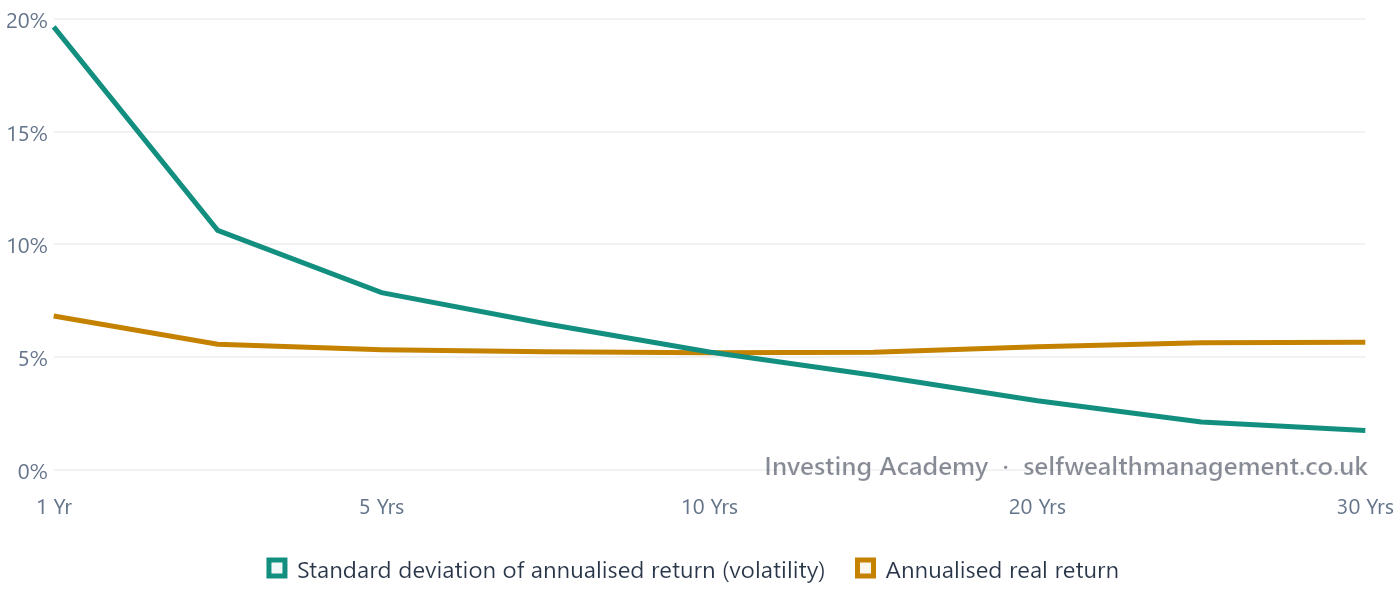
If your money is needed within the next few years, avoiding that short-term volatility may be more important than seeking higher returns. History suggests that as investment periods become longer, shares have increasingly tended to outperform cash.
This is rolling return data from the Barclays Equity Gilt Study, which has tracked UK asset returns since 1899 — meaning it covers every single possible holding period of that length over the last 124 years, not just recent history. That means it captures periods spanning wars, depressions and financial crises, not a cherry-picked calm stretch. It's also worth noting this data is for UK equities specifically, not global shares.
This doesn't mean shares will outperform cash over your investment period. It simply shows that, historically, the probability of outperformance has increased as investment horizons became longer.
There's a second, related pattern worth seeing alongside this one. The chart below shows how much annual equity returns have historically varied around their average (a measure called standard deviation) for the same range of holding periods. Together, the two charts explain why long-term investing has historically rewarded patience. Without making any promises about the future: the longer the holding period, the better the historical odds of beating cash and the lower that volatility has tended to be.
Cash or investing?
It's not usually a choice between one or the other. Most people need both. Cash provides stability and flexibility. Investments aim to provide long-term growth. Finding the right balance depends on your goals and when you'll need your money.
- Cash is generally suitable for short-term goals and emergency savings.
- The value of cash is usually stable.
- Inflation can reduce the purchasing power of cash over time.
- Shares have historically outperformed cash more frequently over longer investment periods, although with greater short-term risk.
Educational disclaimer: This information is for educational purposes only and should not be considered financial advice or a recommendation. Investments can fall as well as rise in value, and you may get back less than you invest. Past performance is not a reliable indicator of future results.
What are Equities?
Equities represent ownership in a company. When you buy a share, you become one of its owners.
Equities, also known as shares or stocks, represent ownership in a company.
When you buy a share, you become one of that company's owners. If the company becomes more valuable, your investment may increase in value. If it performs poorly, your investment may fall. Some companies also pay shareholders part of their profits through dividends.
Why do companies issue shares?
Growing a business costs money. A company may want to build new factories, develop new products or expand into new countries. Rather than borrowing all of the money, it can sell small ownership stakes to investors by issuing shares. Investors provide capital to the business and, in return, hope to share in its future success.
Why do share prices move?
Share prices change because investors are constantly reassessing what a company may be worth. Prices can be influenced by:
- Company profits
- Economic growth
- Interest rates
- Inflation
- Competition
- New technology
- Investor confidence
Some days prices move very little. Other days they can rise or fall significantly. This volatility is a normal part of investing.
Why do people invest in shares?
Historically, shares have produced some of the highest long-term investment returns of any major asset class. They've also been one of the most volatile. Investors accept that short-term uncertainty in exchange for the potential for higher long-term growth.
Owning one share vs owning thousands
Buying shares in a single company can be risky. If that company performs badly, your investment could fall significantly. Many investors choose to own funds instead, giving them exposure to hundreds or even thousands of companies around the world. This is known as diversification, and we'll cover it in a later chapter.
Every globally diversified equity fund ultimately owns thousands of real businesses employing millions of people around the world. When you invest in a global equity fund, you're investing in the success of those businesses over time.
- Shares represent ownership in a company.
- Share prices rise and fall every day.
- Companies may pay dividends to shareholders.
- Historically, shares have delivered higher long-term returns than cash, but with greater short-term volatility.
Educational disclaimer: This information is for educational purposes only and should not be considered financial advice or a recommendation. Investments can fall as well as rise in value, and you may get back less than you invest. Past performance is not a reliable indicator of future results.
What are Bonds?
A bond is simply a loan — governments and companies borrow from investors, and pay regular interest in return.
A bond is simply a loan. When governments or companies need to borrow money, they can issue bonds. Instead of borrowing from a bank, they borrow from investors. In return, they usually agree to pay regular interest and repay the loan on a fixed date.
A simple example
Imagine the UK Government wants to borrow £1 billion. Rather than approaching one bank, it issues bonds. Thousands of investors buy those bonds.
If you buy a £1,000 government bond paying 4% interest, you would normally receive £40 a year until the bond matures, when your £1,000 is repaid.
Why do people invest in bonds?
Bonds have traditionally been used to reduce the ups and downs of a portfolio. Historically they have:
- Been less volatile than shares.
- Produced lower long-term returns than shares.
- Provided regular income through interest payments.
That doesn't mean bonds are risk-free. Their value can still rise and fall.
Why do bond prices change?
Although bonds have fixed interest payments, their market value changes every day. One of the biggest influences is interest rates.
Imagine you own a bond paying 2% interest. If newly issued bonds suddenly pay 5%, fewer investors will want your 2% bond — its price is likely to fall. The opposite is also true: if interest rates fall, existing bonds paying higher interest often become more valuable.
Are government bonds safer than company bonds?
Generally, governments are considered less likely to fail to repay their debts than individual companies. As a result, government bonds have historically been viewed as lower risk. Company bonds usually pay higher interest to compensate investors for taking additional risk.
Bonds aren't always defensive
Many people think bonds always rise when shares fall. History shows this isn't always true. For example, during 2022 both shares and many bonds fell as inflation surged and interest rates increased rapidly.
Although bonds have historically helped reduce portfolio volatility over long periods, there have been periods when both major asset classes have fallen together.
Assuming bonds always rise when shares fall. As 2022 showed, when inflation surged and interest rates rose rapidly, both major asset classes fell together.
- A bond is a loan made to a government or company.
- Bonds usually pay regular interest.
- Bond prices can rise and fall.
- Historically, bonds have often been less volatile than shares, although they still carry risk.
Educational disclaimer: This information is for educational purposes only and should not be considered financial advice or a recommendation. Investments can fall as well as rise in value, and you may get back less than you invest. Past performance is not a reliable indicator of future results.
What is a Fund?
A fund pools money from lots of investors and invests it on their behalf, making broad diversification simple.
A fund pools money from lots of investors and invests it on their behalf.
Instead of buying shares in one company, a fund can own hundreds or even thousands of different investments. This makes diversification much easier.
Why do funds exist?
Imagine you wanted to build a diversified portfolio yourself. You might need to buy shares in hundreds of companies across dozens of countries. That would be expensive, time-consuming and difficult to manage.
A fund does all of this for you. By buying a single fund, you can gain exposure to a wide range of investments.
What can a fund invest in?
Funds can invest in almost anything, including:
- Shares
- Bonds
- Property
- Cash
- Commodities
- Infrastructure
Many funds combine several of these asset classes.
Who manages a fund?
That depends on the type of fund. An active fund has a professional fund manager who decides which investments to buy and sell. A passive fund aims to track a market index instead of trying to beat it. We'll look at these in more detail later.
Are funds safer than individual shares?
Owning a fund doesn't remove investment risk. If markets fall, the value of a fund can also fall.
However, spreading your money across hundreds or thousands of investments reduces the impact of any one company performing badly. This is one of the main reasons diversified funds have become so popular.
Some global index funds own shares in more than 7,000 companies, giving investors exposure to businesses across developed and emerging markets.
- Funds pool money from many investors.
- A single fund can own hundreds or thousands of investments.
- Funds make diversification simple.
- Both active and passive funds are available.
Educational disclaimer: This information is for educational purposes only and should not be considered financial advice or a recommendation. Investments can fall as well as rise in value, and you may get back less than you invest. Past performance is not a reliable indicator of future results.
Diversification
Diversification means not putting all your eggs in one basket — it manages risk, but doesn't eliminate it.
Diversification means spreading your investments across different companies, industries, countries and asset classes.
Instead of relying on one investment, you spread your risk. It's often described as not putting all your eggs in one basket.
Why does diversification matter?
No one knows which investment will perform best next year. Some companies thrive. Others struggle. By owning lots of different investments, you're less reliant on any single company succeeding.
If one investment performs poorly, stronger performance elsewhere may help offset some of the impact. Diversification doesn't eliminate risk — but it can reduce company-specific risk.
A simple example
Imagine you invested all your money into a single company. If that company failed, you could lose a substantial proportion of your investment.
Now imagine you own a global fund invested in more than 7,000 companies. If one company performs badly, its impact on your overall portfolio is likely to be much smaller.
Diversification doesn't stop market falls
It's important to understand what diversification can and can't do. Diversification may reduce the impact of individual investments performing badly. It cannot prevent losses when markets as a whole fall.
During global market downturns, many investments fall together. Diversification helps manage risk — it doesn't remove it.
Diversification is one of the few concepts in investing that almost every investment professional agrees on. Although opinions differ on many things, spreading risk is widely considered a sensible long-term principle.
- Diversification spreads risk across many investments.
- It reduces reliance on individual companies.
- It cannot prevent losses during broad market declines.
- Diversified portfolios have historically experienced lower company-specific risk than concentrated portfolios.
Educational disclaimer: This information is for educational purposes only and should not be considered financial advice or a recommendation. Investments can fall as well as rise in value, and you may get back less than you invest. Past performance is not a reliable indicator of future results.
Active vs Passive Investing
Active investing tries to beat the market; passive investing simply aims to track it — history has generally favoured lower costs.
When you invest in a fund, there are two main approaches.
Active investing involves a professional fund manager selecting investments in an attempt to outperform the market. Passive investing doesn't try to beat the market. Instead, it aims to track the performance of a market index, such as the FTSE All-World Index. Neither approach is right or wrong. They simply take different routes.
Active investing
An active fund manager researches companies, analyses markets and decides what to buy and sell. The goal is simple: outperform the market after fees. To do that, the manager might:
- Buy companies they believe are undervalued.
- Avoid companies they think are overvalued.
- Hold more cash during uncertain periods.
- Invest more heavily in certain sectors or countries.
If those decisions prove correct, the fund may outperform. If they don't, it may underperform.
Passive investing
Passive investing takes a different approach. Rather than trying to identify tomorrow's winners, it simply buys the market. If a company represents 3% of a global index, approximately 3% of the fund is invested in that company.
There are no attempts to predict markets or pick winning shares. The objective is simply to match the market's return as closely as possible, after costs.
What does history suggest?
Over long periods, numerous studies have found that many actively managed funds have underperformed their benchmark after fees. That doesn't mean active investing doesn't work — some active managers have outperformed for long periods. The challenge has been identifying those managers consistently in advance.
Lower costs have been one of the reasons passive investing has become increasingly popular.
A real example
The table below compares two real-life funds from the same investment provider, as of June 2026.
| Global Equity Fund (Active) | Global Equity Fund (Passive) | |
|---|---|---|
| Ongoing Charges Figure (OCF) | 0.48% | 0.18% |
| Holdings | 194 | 6,877 |
| Five-year performance* | 39.02% | 67.80% |
*Past performance is not a reliable indicator of future results.
This example highlights some common differences. The passive fund owns far more companies and charges significantly lower fees. Over this particular five-year period it also produced a higher return. That does not mean passive funds will always outperform active funds — it's simply one real-world example showing how different approaches can lead to different outcomes.
Which approach is better?
There isn't a universal answer. Some investors prefer active funds because they believe skilled managers can add value. Others prefer passive funds because they're simple, diversified and usually lower cost. Many investors choose a combination of both.
At Self Wealth Management, we believe it's important to understand the differences before deciding which approach, if any, is appropriate for you.
Technology shares became extremely popular in the late 1990s. Many companies had little or no profit, yet their share prices continued to rise as investors expected rapid future growth. When expectations changed, markets fell sharply. The Nasdaq Index declined by almost 80% from its peak before eventually recovering over subsequent years.
What can we learn? Actively picking winning companies during periods of hype has historically been difficult. It's one reason many investors have turned to lower-cost, diversified passive funds instead.
- Active funds try to outperform the market.
- Passive funds aim to track the market.
- Passive funds are usually cheaper to run.
- History suggests many active funds have underperformed their benchmarks after fees over long periods, although some have outperformed.
Educational disclaimer: This information is for educational purposes only and should not be considered financial advice or a recommendation. Investments can fall as well as rise in value, and you may get back less than you invest. Past performance is not a reliable indicator of future results.
Understanding Investment Risk
Risk isn't just about losing money — it's the possibility your investment won't behave as you expect.
People often think risk means losing money. In reality, investment risk is much broader than that.
Risk is the possibility that your investment won't behave as you expect. Sometimes that means temporary falls in value. Sometimes it means not achieving your long-term goals. Understanding risk isn't about avoiding it altogether — it's about understanding how much risk you're taking and whether it's appropriate for your circumstances.
1. Time Horizon
How long before you'll need the money? Generally, the longer your investment horizon, the more time there has historically been for markets to recover from temporary falls. Money needed in the next few years is often exposed to greater timing risk than money invested for several decades.
2. Capacity for Loss
Could you still achieve your goals if your investments fell? This isn't about emotions. It's about finances. Someone with substantial savings and secure income may be able to absorb losses more easily than someone relying on that money to retire next year.
3. Attitude to Risk
How comfortable are you with uncertainty? Some people can watch markets fall without changing their plan. Others find even modest declines stressful. Neither response is right or wrong. The best investment strategy is one you can stick with during difficult periods.
4. Need for Risk
How much growth do you actually need? If your goals can be achieved with lower-risk investments, taking additional risk may not be necessary. Equally, some long-term goals may require higher expected returns. Finding the right balance is an important part of financial planning.
Risk and return
Historically, investments with higher expected returns have generally experienced greater short-term volatility. That's the trade-off. Higher potential reward has usually required accepting greater uncertainty. No investment offers high returns without risk.
Can I reduce investment risk?
Not entirely. Every investment carries some form of risk. What you can do is manage it. Historically, investors have often reduced risk by:
- Diversifying.
- Investing for longer.
- Keeping costs low.
- Avoiding emotional decisions.
- Investing according to their goals rather than short-term market movements.
Drag the slider to explore how different mixes of cash, bonds and shares have performed over 124 years of UK market history. Higher returns have historically come with wider swings — the goal is finding the balance you can stick with over the long term.
True or false: a portfolio invested 100% in shares has never had a negative calendar year.
- Every investment involves risk.
- Risk means more than simply losing money.
- Time horizon, capacity for loss, attitude to risk and need for risk all matter.
- Higher expected returns have historically come with greater uncertainty.
Educational disclaimer: This information is for educational purposes only and should not be considered financial advice or a recommendation. Investments can fall as well as rise in value, and you may get back less than you invest. Past performance is not a reliable indicator of future results.
Bull Markets & Bear Markets
Bull markets rise, bear markets fall — and history shows markets have spent far more time rising than falling.
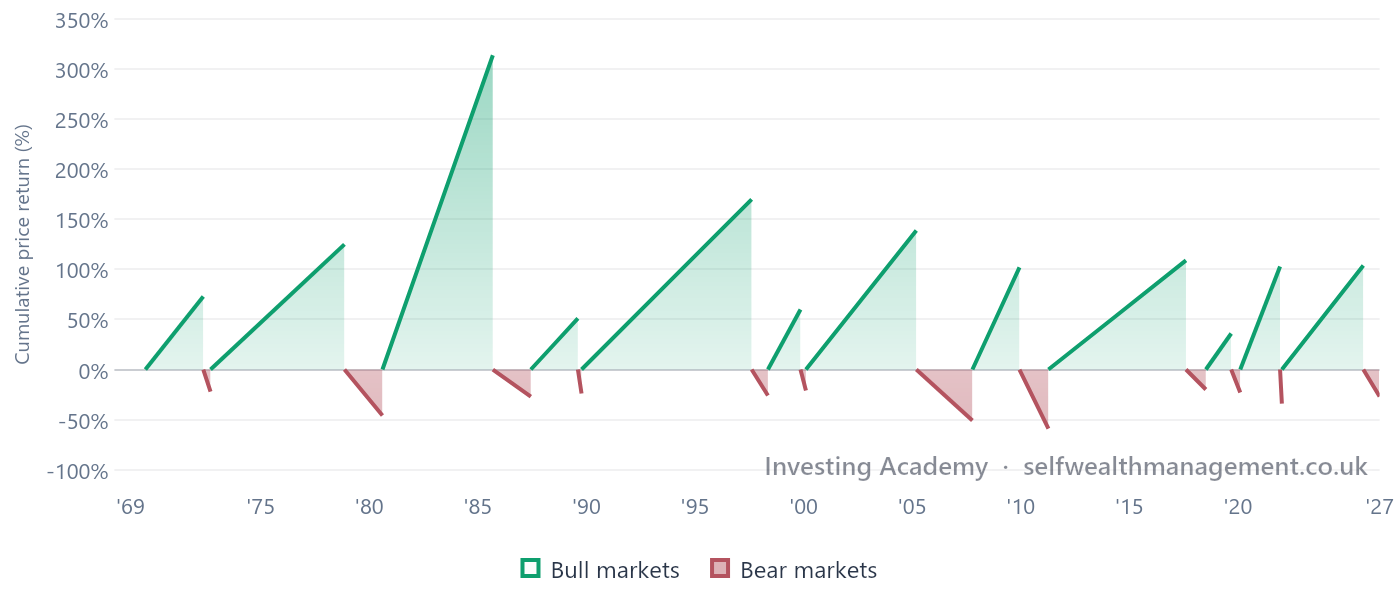
A bull market is a prolonged period where markets are generally rising. There isn't an official time period, but it usually describes a sustained increase in share prices, often supported by economic growth, improving company profits and investor confidence. Bull markets don't rise in a straight line — there will still be setbacks along the way.
A bear market is generally defined as a fall of 20% or more from a recent market high. Bear markets are often caused by events such as recessions, financial crises, wars or unexpected economic shocks. Although they can feel severe at the time, history shows they have always eventually come to an end.
Bull markets have historically lasted much longer
Bear markets attract the headlines because they're dramatic. Bull markets quietly create wealth. Historically, markets have spent significantly more time rising than falling. That's one reason long-term investors have generally been rewarded for remaining invested.
Looking at 24 MSCI World bull and bear cycles since 1970, the average bull market has lasted around 46 months (roughly 3.8 years), while the average bear market has lasted around 11 months — well under a year. Bull markets haven't just been more common; they've typically run for four to five times as long as the bear markets that followed them.
Why this matters
During every bear market there are reasons why "this time feels different." The headlines are often alarming. Markets can fall sharply. Nobody knows exactly when they'll recover.
History doesn't tell us when the next recovery will begin, but it does show that recoveries have followed every previous bear market. For long-term investors, remaining focused on their plan has often proved more valuable than reacting to short-term headlines.
Every recovery starts before the news improves
One of the challenges with investing is that markets usually recover before the economy feels healthy again. By the time confidence returns, markets may already have risen substantially. This is one reason why trying to move in and out of markets has historically been so difficult.
On 19 October 1987, US markets fell more than 20% in a single trading day — the largest one-day percentage decline in history. It was frightening for investors, but markets eventually recovered.
What can we learn? Large market falls can happen very quickly. Short-term volatility has always been part of investing.
- Bull markets are prolonged periods of rising markets.
- Bear markets are generally defined as falls of 20% or more.
- Bull markets have historically lasted much longer than bear markets.
- Every bear market in history has eventually been followed by a recovery, although the timing has varied.
Educational disclaimer: This information is for educational purposes only and should not be considered financial advice or a recommendation. Investments can fall as well as rise in value, and you may get back less than you invest. Past performance is not a reliable indicator of future results.
Why Staying Invested Matters
Missing just a handful of the market's strongest days has historically had a significant impact on long-term returns.
Why do investors sell? Usually because they're frightened. Watching your investments fall is uncomfortable. It's natural to want to stop the losses.
The difficulty is that nobody knows when markets will recover. Selling protects you from further falls — but it also means you may miss the recovery.
The problem with timing the market
Many investors believe they can sell before markets fall and buy back before they recover. History suggests this is extremely difficult to do consistently. Missing just a handful of the market's strongest days has historically had a significant impact on long-term returns.
Why is this important?
Some of the market's biggest gains have happened within days of its biggest falls. That's because markets move quickly. When confidence returns, prices often recover before investors feel comfortable buying again. Waiting for certainty has historically been an expensive strategy.
Does this mean you should never sell?
No. Sometimes selling is entirely appropriate. For example:
- Your goals have changed.
- You need the money.
- Your circumstances have changed.
- Your original investment strategy was no longer appropriate.
What history doesn't generally support is selling simply because markets have fallen.
Investing is emotional
Successful investing isn't just about choosing good investments. It's about sticking with a sensible plan when markets become uncomfortable. For many investors, managing emotions has been just as important as choosing the right portfolio.
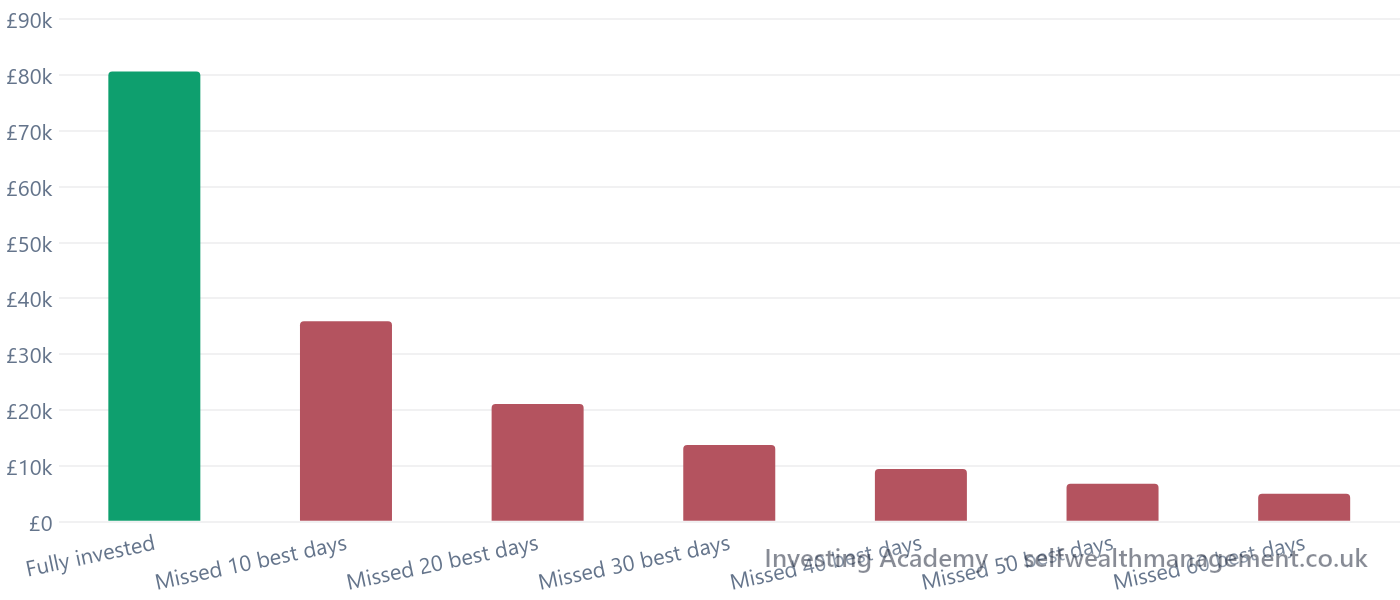
Selling after a sharp fall "to avoid further losses", then waiting for things to feel safe again before reinvesting. Markets have often recovered before that feeling of safety returns — meaning the recovery gets missed entirely.
- Market falls are a normal part of investing.
- Missing the market's strongest days has historically reduced long-term returns.
- Recoveries often begin before confidence returns.
- History generally suggests reacting emotionally to market falls has often produced poorer long-term outcomes.
Educational disclaimer: This information is for educational purposes only and should not be considered financial advice or a recommendation. Investments can fall as well as rise in value, and you may get back less than you invest. Past performance is not a reliable indicator of future results.
Asset Allocation
Asset allocation — how your money is divided between cash, bonds, shares and other assets — has historically had a bigger influence on returns than picking individual investments.
Asset allocation is simply how your money is divided between different types of investments — for example, cash, bonds, shares, property, and alternative investments.
For many investors, asset allocation has historically had a greater influence on long-term returns and volatility than choosing individual investments.
Why does it matter?
Different assets behave differently. Shares have historically delivered higher long-term returns but greater short-term volatility. Cash has generally been more stable but produced lower long-term returns. Bonds have often sat somewhere in between.
Combining different assets helps create a portfolio suited to your objectives and tolerance for risk.
There isn't a perfect allocation
The "best" asset allocation depends on you. Things that influence it include:
- Your age.
- Your goals.
- When you'll need the money.
- Your attitude to risk.
- Your capacity for loss.
Someone investing for retirement in 35 years is likely to have different needs from someone planning to buy a house next year.
Example portfolios
These are examples only. Many different allocations can be appropriate.
| Risk Profile | Shares | Bonds | Cash |
|---|---|---|---|
| Lower Risk | 20% | 70% | 10% |
| Balanced | 60% | 40% | 0% |
| Higher Risk | 80% | 20% | 0% |
| Very High Risk | 100% | 0% | 0% |
Why don't younger investors always invest 100% in shares?
Many do. Some don't. Although younger investors generally have longer time horizons, investment decisions should also consider financial circumstances and personal comfort with risk. There is no single allocation that suits everyone.
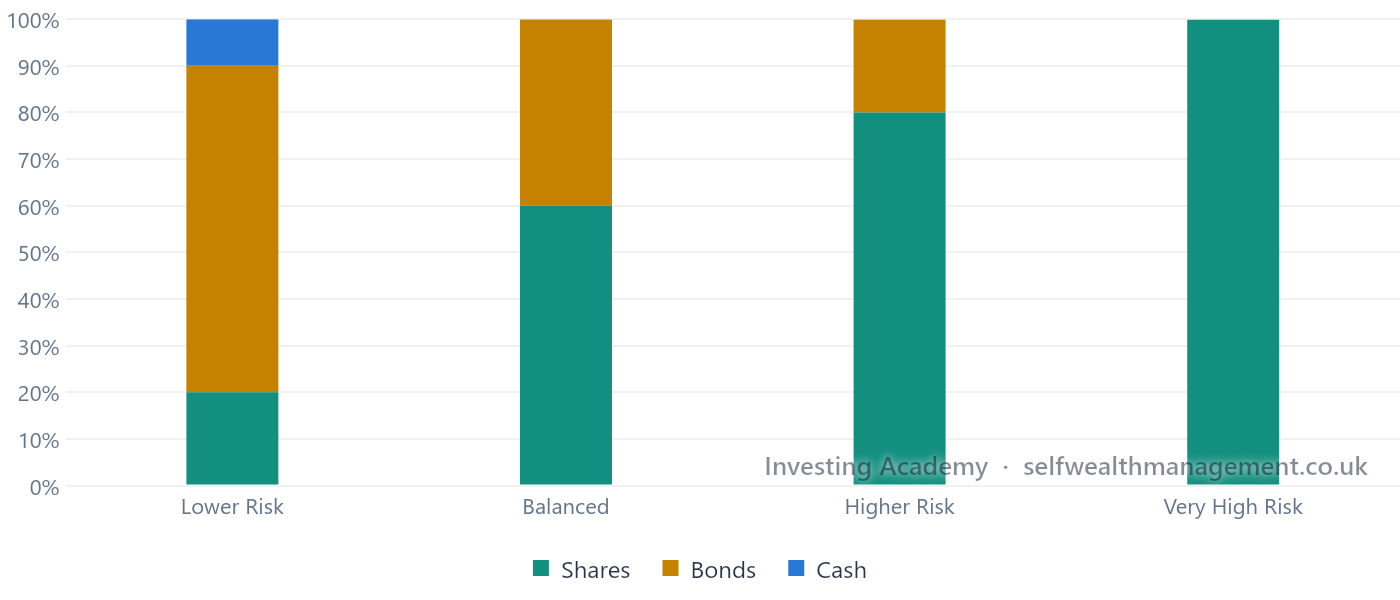
Two investors holding exactly the same funds can experience very different outcomes if their overall asset allocation is different.
- Asset allocation is how your investments are divided.
- Different assets have different characteristics.
- Your allocation should reflect your own circumstances and objectives.
- There is no universally 'correct' portfolio.
Educational disclaimer: This information is for educational purposes only and should not be considered financial advice or a recommendation. Investments can fall as well as rise in value, and you may get back less than you invest. Past performance is not a reliable indicator of future results.
Regular Investing vs Lump Sum Investing
A lump sum gives your money more time in the market; regular investing builds a habit and smooths the price you pay.
There are two common ways to invest. You can invest a lump sum all at once, or you can invest smaller amounts regularly, such as monthly. Both approaches have advantages. Neither is always better.
Investing a lump sum
A lump sum gives your money more time in the market. Because markets have historically risen more often than they've fallen, investing earlier has generally produced better long-term outcomes than waiting. This is sometimes summarised as:
Time in the market has historically been more important than timing the market.
Of course, markets can fall shortly after you invest, so there are no guarantees.
Regular investing
Regular investing means contributing a fixed amount each month. This is often known as pound-cost averaging. When prices are high, your money buys fewer investments. When prices are low, it buys more. Over time, this averages out the price you pay.
Many people also find regular investing easier because it builds a habit and removes the temptation to wait for the "perfect" time to invest.
Which has historically performed better?
Where someone already has a lump sum available to invest, history suggests investing it immediately has generally produced better long-term returns than investing it gradually. This is because markets have historically spent more time rising than falling.
That doesn't mean it will always be the better outcome. Some investors prefer to invest gradually because it feels more comfortable.
Which approach is right?
That depends on your circumstances. If you already have money available to invest, history generally favours investing it sooner. If you're building wealth from your salary, regular investing is often the most practical approach. Many investors use both throughout their lives.
As the world shut down during the pandemic, global markets fell at record speed. Governments and central banks introduced unprecedented support measures, and markets recovered far sooner than many expected.
What can we learn? Investors who kept contributing through the fall — via a workplace pension or regular investment plan — automatically bought at some of the lowest prices of the decade, without needing to predict anything.
- Lump sums give money longer to grow.
- Regular investing averages the price paid.
- Markets have historically favoured investing earlier.
- Consistency is often more important than finding the perfect time.
Educational disclaimer: This information is for educational purposes only and should not be considered financial advice or a recommendation. Investments can fall as well as rise in value, and you may get back less than you invest. Past performance is not a reliable indicator of future results.
Charges & Fees
Every pound paid in charges is a pound that's no longer invested and no longer benefiting from compound growth.
Fees might seem small. Over decades, they can have a surprisingly large impact.
Every pound paid in charges is a pound that's no longer invested and no longer benefiting from compound growth.
What types of charges are there?
Depending on where you invest, you may pay:
- Fund charges (Ongoing Charge Figure or OCF)
- Platform fees
- Adviser fees
- Transaction costs
Some investments have all of these. Others have very few.
Small percentages matter
Imagine two investors. Both earn exactly the same investment return before fees. One pays annual charges of 0.20%. The other pays 1.20%.
After 30 years, the lower-cost portfolio is likely to be worth significantly more because more money remained invested throughout the journey.
Does cheaper always mean better?
No. A higher-cost investment may still be worthwhile if it consistently delivers better outcomes after fees. The challenge is that consistently identifying those investments in advance has historically proved difficult.
Understanding what you're paying — and what you're receiving in return — is often more important than simply choosing the cheapest option.
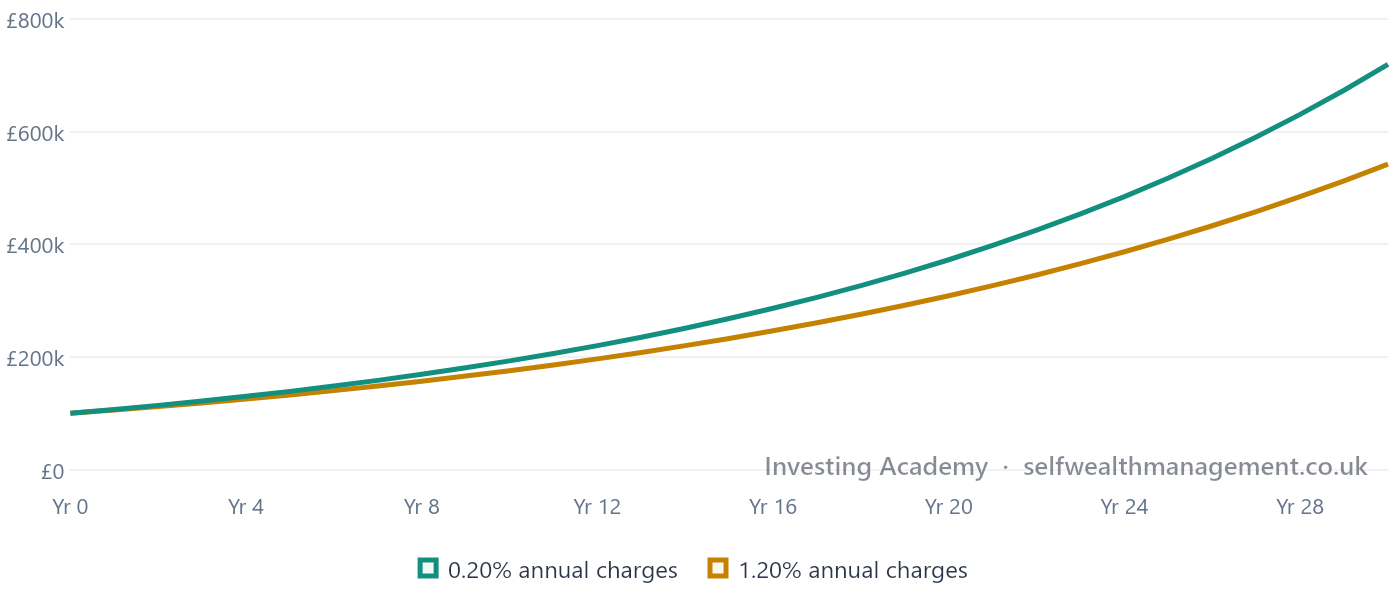
- Fees reduce investment returns.
- Small annual charges can have a large long-term impact.
- Lower cost doesn't automatically mean better.
- Always understand what you're paying for.
Educational disclaimer: This information is for educational purposes only and should not be considered financial advice or a recommendation. Investments can fall as well as rise in value, and you may get back less than you invest. Past performance is not a reliable indicator of future results.
Understanding Volatility
Volatility is a normal part of investing, not a sign that something has gone wrong.
Volatility simply means prices move. Some days markets rise. Some days they fall. Sometimes those movements are small. Occasionally they're much larger.
Volatility is a normal part of investing — not a sign that something has gone wrong.
Why does volatility happen?
Markets react to new information. For example:
- Company results
- Inflation data
- Interest rate changes
- Elections
- Wars
- Technological advances
- Investor sentiment
Millions of investors are constantly reassessing what assets are worth. Prices adjust accordingly.
Volatility isn't the same as loss
If an investment falls by 15%, you've experienced a fall in value. Whether that becomes a permanent loss often depends on what happens next.
Selling after markets fall turns a temporary decline into a realised loss. Remaining invested gives markets the opportunity to recover, although recovery is never guaranteed.
Why long-term investors view volatility differently
Someone retiring next year may see market volatility as a major concern. Someone investing for retirement in 30 years may view the same market fall very differently. Time changes how volatility affects your financial goals.
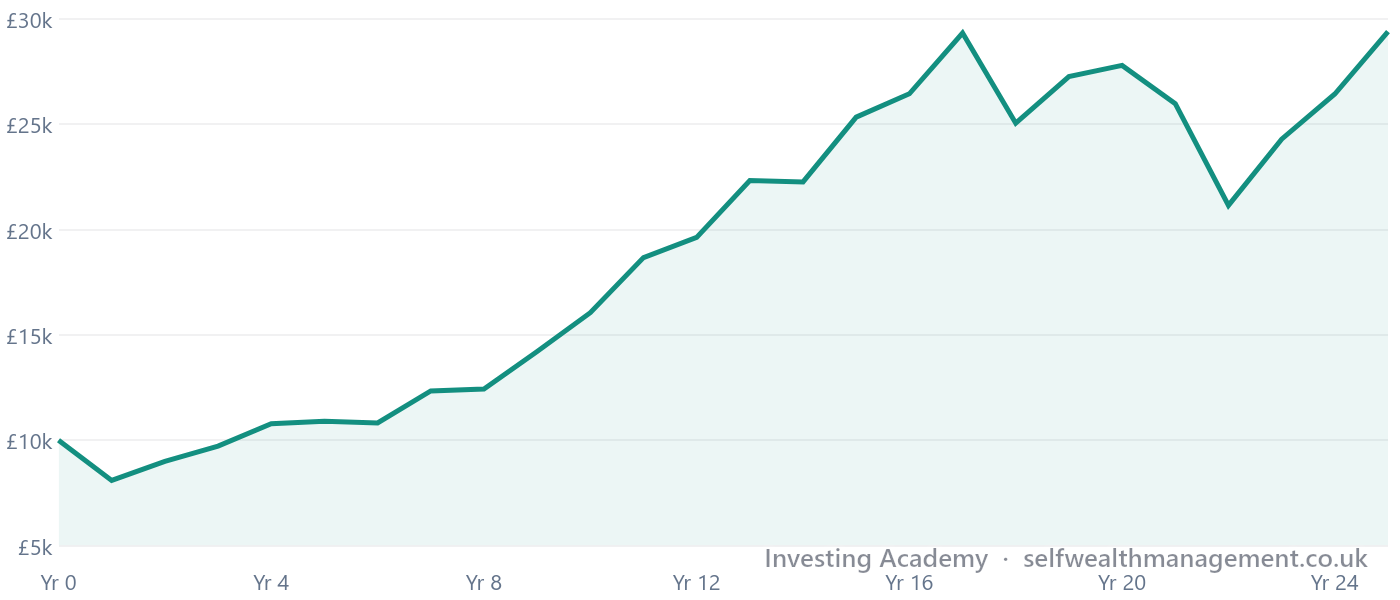
It's perfectly possible for an investment to finish the year higher than it started while experiencing several sharp falls along the way. The S&P 500 historically falls by roughly 14% during each year, but still finishes the calendar year with a positive annual return 75% of the time.
- Volatility means prices move up and down.
- It's a normal part of investing.
- Volatility isn't the same as permanent loss.
- Long-term investors have historically experienced many periods of volatility.
Educational disclaimer: This information is for educational purposes only and should not be considered financial advice or a recommendation. Investments can fall as well as rise in value, and you may get back less than you invest. Past performance is not a reliable indicator of future results.
Market Timing vs Time in the Market
Getting one timing decision right is hard. Getting both — when to sell and when to buy back — consistently, is even harder.
Many people try to consistently predict markets. Very few succeed consistently over long periods. Markets are influenced by countless factors, many of which are impossible to predict. Even professional investors regularly disagree about what will happen next.
Why is timing so difficult?
Imagine you sell because you're worried markets might fall. You now have two decisions to make: when to sell, and when to buy back. Getting one right is difficult. Getting both right consistently is even harder.
History suggests…
Markets have historically spent more time rising than falling. Many of the strongest recovery days have occurred shortly after significant declines. Waiting until everything feels "safe" has often meant buying back after markets have already recovered.
Does this mean never make changes?
No. Reviewing your investments remains important. Changes may be appropriate if your goals change, your circumstances change, your time horizon changes, or your original strategy was no longer suitable. That's very different from reacting to short-term headlines.
True or false: professional fund managers have historically been able to reliably predict market tops and bottoms.
- Predicting markets consistently is extremely difficult.
- Staying invested has historically produced better outcomes than frequent trading for many long-term investors.
- Investment decisions should be driven by your goals, not short-term news.
Educational disclaimer: This information is for educational purposes only and should not be considered financial advice or a recommendation. Investments can fall as well as rise in value, and you may get back less than you invest. Past performance is not a reliable indicator of future results.
What is an Index?
An index is a scoreboard — a way of measuring the combined performance of a group of investments.
An index is simply a way of measuring the performance of a group of investments. Think of it as a scoreboard. Rather than tracking one company, an index tracks hundreds or even thousands of companies together. When you hear the news say, "The stock market was up today," they're usually referring to an index.
Some common indices
You don't need to memorise these, but you'll come across them regularly.
| Index | What it tracks |
|---|---|
| FTSE 100 | The UK's 100 largest listed companies. |
| S&P 500 | Around 500 of the largest companies in the United States. |
| FTSE All-World | Thousands of companies across developed and emerging markets. |
| MSCI World | Large and medium-sized companies in developed countries. |
Each index represents a different part of the global market.
Why are indices useful?
They allow investors to answer questions like:
- How has the UK market performed?
- How has the US market performed?
- How have global shares performed?
- Has my investment performed better or worse than the wider market?
Without indices, it would be difficult to judge performance.
Why do passive funds use indices?
A passive fund doesn't try to beat the market. Instead, it aims to follow an index as closely as possible. If the FTSE All-World Index rises by 8%, a passive fund tracking that index aims to produce a very similar return, after costs.
The FTSE All-World Index contains companies from both developed and emerging markets, giving investors exposure to much of the global stock market through a single investment.
- An index measures the performance of a group of investments.
- Indices are used to track markets.
- Passive funds generally aim to follow an index rather than beat it.
- Different indices track different parts of the world.
Educational disclaimer: This information is for educational purposes only and should not be considered financial advice or a recommendation. Investments can fall as well as rise in value, and you may get back less than you invest. Past performance is not a reliable indicator of future results.
What is an ETF?
An ETF is a fund that trades on a stock exchange throughout the day, rather than being priced once daily.
ETF stands for Exchange Traded Fund. An ETF is simply a fund that can be bought and sold throughout the trading day on a stock exchange. Many ETFs are passive and track an index, although some are actively managed.
How is an ETF different from a traditional fund?
The investments inside are often very similar. The main difference is how they're bought and sold.
| Traditional Fund | ETF |
|---|---|
| Usually priced once each day | Trades throughout the day |
| Bought directly through a platform | Bought on a stock exchange |
| Often used for long-term investing | Used by both long-term investors and traders |
For many long-term investors, these differences make little practical difference.
Why are ETFs popular?
Many ETFs are:
- Low cost
- Diversified
- Easy to buy and sell
- Transparent about what they own
They've become one of the most popular investment vehicles in the world.
The first index fund available to individual investors launched in the US in 1976. It was initially met with scepticism, sometimes nicknamed "un-American" for aiming only to match the market rather than beat it.
What can we learn? The same low-cost, broadly diversified idea behind that fund is what underpins most ETFs today. Ideas that challenge convention can take time to be accepted.
- ETFs are funds traded on stock exchanges.
- Many ETFs track market indices.
- Most offer broad diversification.
- ETFs can be suitable for long-term investing, depending on an investor's circumstances.
Educational disclaimer: This information is for educational purposes only and should not be considered financial advice or a recommendation. Investments can fall as well as rise in value, and you may get back less than you invest. Past performance is not a reliable indicator of future results.
Understanding Dividends
A dividend is a portion of company profit paid to shareholders — and reinvesting them lets compound growth work even harder.
A dividend is a payment made by a company to its shareholders. If a company makes a profit, it may decide to keep that money to grow the business, pay down debt, buy back shares, or distribute some of it to investors. That distribution is called a dividend.
Why do dividends matter?
Dividends have historically formed an important part of long-term investment returns. Investors can take dividends as income, or reinvest them to buy more investments. Reinvesting dividends allows compound growth to work even harder.
Are dividends guaranteed?
No. Companies can increase dividends, reduce dividends, or suspend dividends altogether. Dividend payments depend on the financial health of the business and decisions made by its board.
Income or growth?
Some investors rely on dividends to provide an income, particularly during retirement. Others automatically reinvest dividends to maximise long-term growth. Neither approach is universally better. It depends on your objectives.
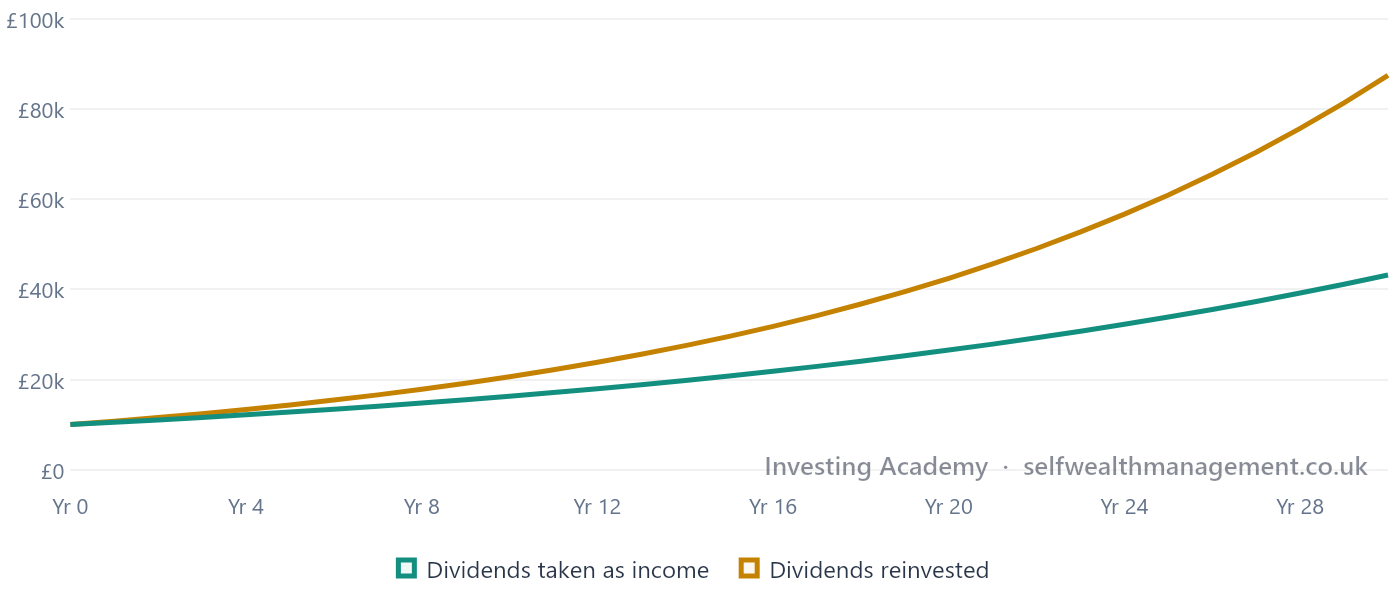
- Dividends are payments from companies to shareholders.
- They are not guaranteed.
- Reinvesting dividends has historically enhanced long-term returns.
- Some investors take dividends as income, while others reinvest them.
Educational disclaimer: This information is for educational purposes only and should not be considered financial advice or a recommendation. Investments can fall as well as rise in value, and you may get back less than you invest. Past performance is not a reliable indicator of future results.
Why Global Investing Matters
No one knows which country will win next — spreading investments across the world reduces reliance on any single market.
No one knows which country will produce the best investment returns over the next decade. Some years the US leads. Other years Europe performs better. Sometimes emerging markets outperform both. Rather than trying to predict the winner, many investors spread their investments across the world.
Home bias
Many investors naturally invest heavily in companies from their own country. This is known as home bias. While investing in familiar businesses can feel comfortable, concentrating too much in one country increases the risk that poor performance in that market has a significant impact on your portfolio.
The world changes
The largest companies today aren't the same as they were 30 years ago. New industries emerge. Others decline. Global investing allows portfolios to evolve alongside the global economy.
You're investing in businesses, not countries
A global fund might own companies such as Apple, Microsoft, Nestlé, Toyota, Novo Nordisk, AstraZeneca and Samsung. These businesses generate revenues from customers all over the world.
Global investing isn't simply about geography — it's about owning a broad range of businesses operating across different sectors and economies.
Home bias — keeping the large majority of a portfolio in UK companies because they feel familiar, even though the UK represents only a small slice of the global market.
- No country consistently outperforms every year.
- Global investing spreads risk across different economies.
- It reduces reliance on a single market.
- Many global companies generate revenues worldwide.
Educational disclaimer: This information is for educational purposes only and should not be considered financial advice or a recommendation. Investments can fall as well as rise in value, and you may get back less than you invest. Past performance is not a reliable indicator of future results.
Why Don't Markets Always Go Up?
Markets reflect what investors expect will happen tomorrow, not just what's happening today — which is why they often move on surprises, not headlines.
It's a fair question. If businesses become more profitable over time, why do markets sometimes fall by 20%, 30% or even 50%?
The answer is that markets don't just reflect what's happening today. They reflect what investors expect will happen tomorrow. Every day, millions of investors around the world are trying to value businesses based on future profits, not today's news. When expectations change, prices change.
Markets hate uncertainty
Markets generally cope well with bad news. What they dislike is uncertainty. Unexpected events such as recessions, wars, inflation, interest rate rises or political instability can all make investors less confident about the future. That uncertainty often leads to falling prices.
Bad news doesn't always mean falling markets
This surprises many new investors. Sometimes terrible economic news barely affects markets. Other times, markets rise. That's because markets had already expected the bad news. Likewise, good news doesn't always push markets higher if investors were expecting something even better.
Markets respond to surprises — not simply headlines.
Markets look ahead
The stock market is often described as a forward-looking indicator. Investors are constantly asking: what might happen next year? Will profits grow? Could interest rates fall? Will inflation improve? Are companies becoming more valuable?
That's why markets often recover long before the economy feels healthy again.
True or false: bad economic news always causes markets to fall.
- Markets are driven by expectations, not just current events.
- Uncertainty often causes prices to fall.
- Markets frequently recover before the economy does.
- Short-term headlines don't always reflect long-term investment outcomes.
Educational disclaimer: This information is for educational purposes only and should not be considered financial advice or a recommendation. Investments can fall as well as rise in value, and you may get back less than you invest. Past performance is not a reliable indicator of future results.
Why Inflation and Interest Rates Matter
Interest rates ripple through the whole economy — and through the value of almost every investment.
Interest rates affect almost every part of the economy. They influence mortgage costs, savings rates, business borrowing, consumer spending, company profits, and investment markets. When interest rates change, the value of many investments can change too.
Higher interest rates
When interest rates rise: borrowing becomes more expensive, mortgage payments often increase, consumers may spend less, and businesses may invest less.
As a result, company profits can come under pressure. That can affect share prices. Higher interest rates have also historically reduced the value of many existing bonds.
Lower interest rates
When interest rates fall: borrowing generally becomes cheaper, businesses may invest more, consumers may spend more, and economic growth may improve.
Lower interest rates have historically supported both shares and bonds, although this is not guaranteed.
Inflation and interest rates work together
Central banks often increase interest rates when inflation is high. The aim is to slow spending and reduce inflation. When inflation falls, interest rates may also fall over time. Markets constantly adjust to these expectations.
Financial markets often react more to what central banks say they might do than to what they actually do.
- Interest rates influence the economy and investment markets.
- Higher rates can reduce company profits and affect investment values.
- Lower rates can support economic growth.
- Markets often react to expectations about future interest rates.
Educational disclaimer: This information is for educational purposes only and should not be considered financial advice or a recommendation. Investments can fall as well as rise in value, and you may get back less than you invest. Past performance is not a reliable indicator of future results.
Why Investing Feels Difficult
Investing is as much psychological as financial — and losses tend to hurt more than equivalent gains feel good.
One of the biggest challenges isn't understanding investing. It's managing emotions. Even experienced investors feel uncomfortable when markets fall. That's completely normal.
Losses hurt more than gains feel good
Behavioural economists have found that people generally feel the pain of losing money more strongly than the pleasure of making it. This is known as loss aversion. It's one reason investors sometimes make decisions they later regret.
Common investing mistakes
History suggests investors often:
- Panic during market falls.
- Chase investments after they've already risen sharply.
- Try to predict markets.
- Focus too much on short-term news.
- Check their portfolio too often.
None of these behaviours are unique. They're part of being human.
Good investing is often boring
Successful long-term investing rarely makes headlines. It's usually about saving regularly, diversifying, keeping costs low, remaining patient, and reviewing your plan occasionally rather than constantly.
Simple doesn't mean easy.
The collapse of the US housing market triggered a global banking crisis. Equity markets around the world fell dramatically and many investors questioned whether they would ever recover. Global markets eventually recovered and went on to reach new highs over the following years.
What can we learn? Even during the most frightening periods in market history, panic-selling near the bottom has historically proved far more costly than staying the course.
- Investing is as much psychological as financial.
- Market falls are uncomfortable for almost everyone.
- Long-term success often comes from consistency rather than clever predictions.
- Emotional decisions have historically reduced investment returns for many investors.
Educational disclaimer: This information is for educational purposes only and should not be considered financial advice or a recommendation. Investments can fall as well as rise in value, and you may get back less than you invest. Past performance is not a reliable indicator of future results.
Bringing It All Together
Knowledge builds confidence. Patience builds wealth.
After reading this Academy, you don't need to predict markets. You don't need to know what interest rates will do next year. You don't need to find the next big investment.
Instead, history suggests long-term investing has often been built on a handful of simple principles.
The principles
- Invest regularly.
- Stay diversified.
- Keep costs under control.
- Think long term.
- Accept that markets will rise and fall.
- Review your plan when your life changes — not every time the news does.
What matters most?
Nobody knows what the best-performing investment will be next year. What you can control is: how much you save, how much you spend, your investment costs, your diversification, your behaviour, and how long you remain invested.
Those decisions have a far greater influence over your financial future than tomorrow's headlines.
Investing is a journey
There will be years when markets perform well. There will be years when they disappoint. That's normal. The objective isn't to avoid every downturn. It's to build a plan that's capable of surviving them.
Since the Industrial Revolution, investors have lived through wars, recessions, pandemics, financial crises, political upheaval and periods of very high inflation. Despite all of it, global businesses have continued to innovate, adapt and create value over the long term. Successful investing has never required predicting every crisis — history suggests it has generally rewarded patience, diversification and long-term thinking instead.
Final Thoughts
Investing involves uncertainty. It always has. But history suggests that people who understand how investing works are often better equipped to make informed decisions and avoid reacting emotionally during periods of uncertainty.
Our aim has never been to tell you what to do. It's to give you the knowledge and tools to decide what's right for you.
Thank you for reading
We hope this Academy has helped make investing feel a little less intimidating and a lot more understandable. Keep learning. Keep asking questions. And remember:
The best investment you can make is often in your own understanding.
- Invest regularly, stay diversified, and keep costs under control.
- Think long term and accept that markets will rise and fall.
- What you can control — saving, costs, diversification, behaviour — matters more than tomorrow's headlines.
- Knowledge builds confidence. Patience builds wealth.
Educational disclaimer: This information is for educational purposes only and should not be considered financial advice or a recommendation. Investments can fall as well as rise in value, and you may get back less than you invest. Past performance is not a reliable indicator of future results.
Sequence of Returns Risk
Two investors can average the same return over 30 years and end up with wildly different outcomes — because the order returns arrive in matters once you start withdrawing.
Imagine two investors. Both average 7% a year over 30 years. One retires comfortably. The other runs out of money. How? Because the order of returns matters once you start taking withdrawals.
What is sequence risk?
While you're saving, market falls can actually help — your monthly contributions buy more investments at lower prices. Once you're retired and withdrawing money, the opposite happens. If markets fall early in retirement, you're forced to sell more investments at lower prices. Those investments can never participate in the recovery. That's sequence risk.
Example
Investor A retires. Markets fall 25% during the first two years. They're withdrawing £40,000 every year, so they're selling investments while prices are low. Even if markets recover afterwards, there's less money left to recover.
Investor B experiences exactly the same market crash — but it happens in year 20 of retirement instead. The outcome is dramatically different. Same average return. Different sequence.
Why this matters
Many people spend years choosing investments without ever thinking about sequence risk. In reality, it's often one of the biggest risks retirees face.
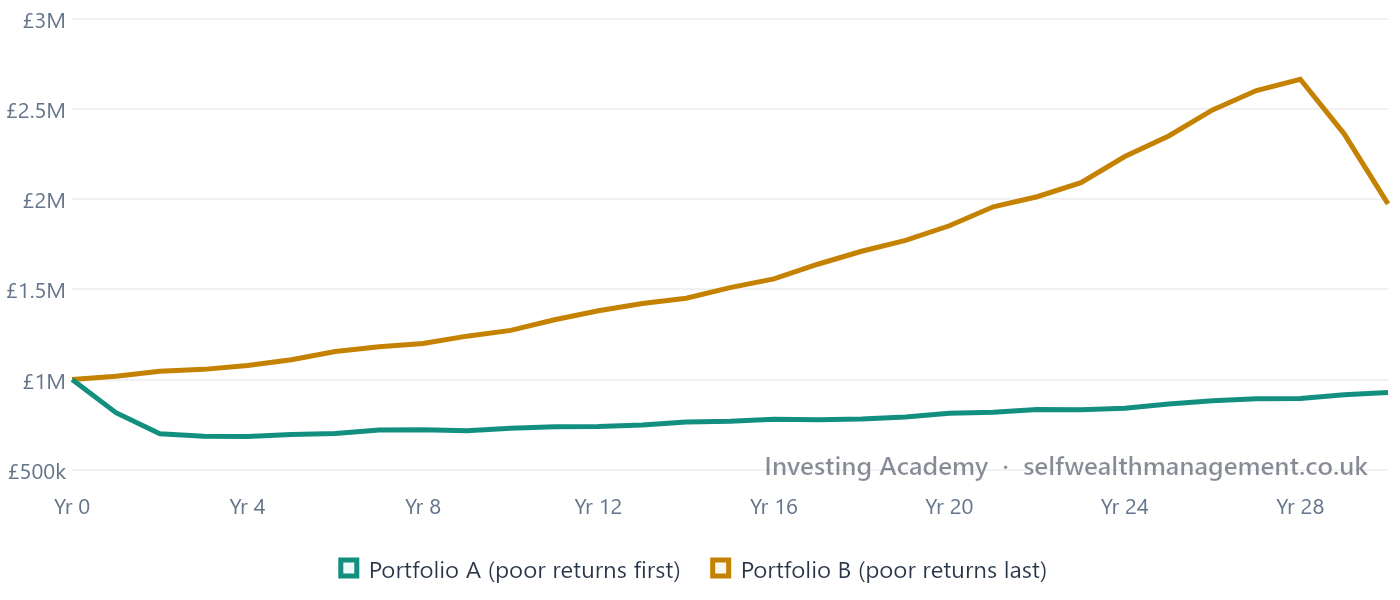
Assuming an "average" expected return will arrive smoothly and evenly. In reality, the order returns arrive in matters enormously once withdrawals begin — two retirements with identical average returns can have completely different outcomes.
- Average return isn't the whole story.
- The order of returns matters during retirement withdrawals.
- Sequence risk is greatest in the early years of retirement.
- The same average return can produce very different outcomes depending on sequence.
Educational disclaimer: This information is for educational purposes only and should not be considered financial advice or a recommendation. Investments can fall as well as rise in value, and you may get back less than you invest. Past performance is not a reliable indicator of future results.
The 4% Rule (and why it isn't a rule)
The 4% Rule is a useful historical starting point for retirement withdrawals — not a guarantee.
Everyone has heard of the 4% Rule. Many misunderstand it. It doesn't say: withdraw exactly 4% forever.
Where it came from
It came from research examining historical US market returns. The researchers asked: "How much could someone have withdrawn each year without historically running out of money over a 30-year retirement?" The answer was around 4%.
But…
The study assumed US markets, historical data, a 30-year retirement, and specific asset allocations. Your retirement may look completely different. That's why many advisers don't treat 4% as a rule. It's simply a useful starting point.
A better question
Rather than asking "What's the safe withdrawal rate?", a more useful question is: "How much can I spend while giving myself a high probability of not running out of money?" That's a far more personal calculation — one that depends on your own time horizon, asset allocation and flexibility.
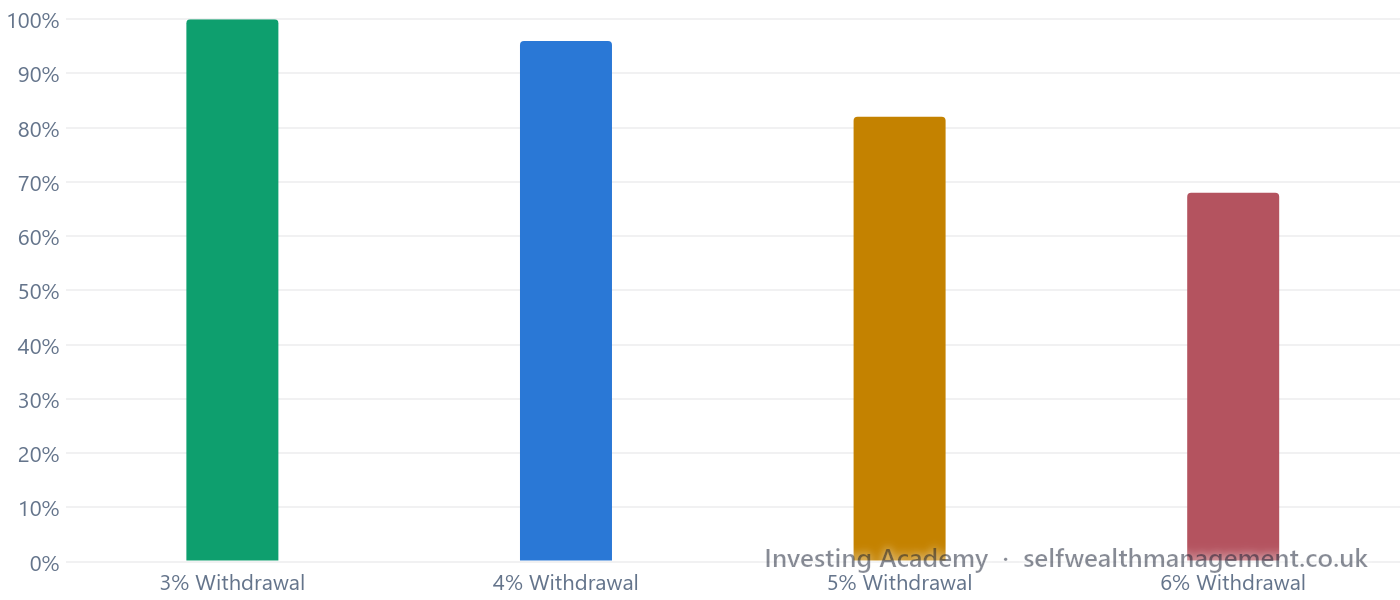
The 4% figure comes from research by financial adviser William Bengen, published in 1994, and was later reinforced by the "Trinity Study" — both based on historical US market data covering periods including the Great Depression.
- The 4% Rule is a historical starting point, not a guaranteed formula.
- It was based on specific assumptions about markets, time horizon and allocation.
- Your own circumstances may call for a different approach.
- A more useful question focuses on probability of success, not a fixed percentage.
Educational disclaimer: This information is for educational purposes only and should not be considered financial advice or a recommendation. Investments can fall as well as rise in value, and you may get back less than you invest. Past performance is not a reliable indicator of future results.
Why Rebalancing Matters
Left alone, a portfolio's mix drifts as markets move — rebalancing brings it back to your intended plan.
Markets don't move together. Suppose you wanted 60% shares and 40% bonds. A fantastic year for shares might leave you with 75% shares and 25% bonds. Without realising it, you've taken on more risk. Rebalancing simply means bringing your investments back towards your intended allocation.
Why it matters
Rebalancing naturally encourages investors to sell small amounts of assets that have performed well, and buy assets that have underperformed. That's psychologically difficult — it can feel like selling your winners and buying your losers — but historically it's often helped investors maintain their desired level of risk over time.
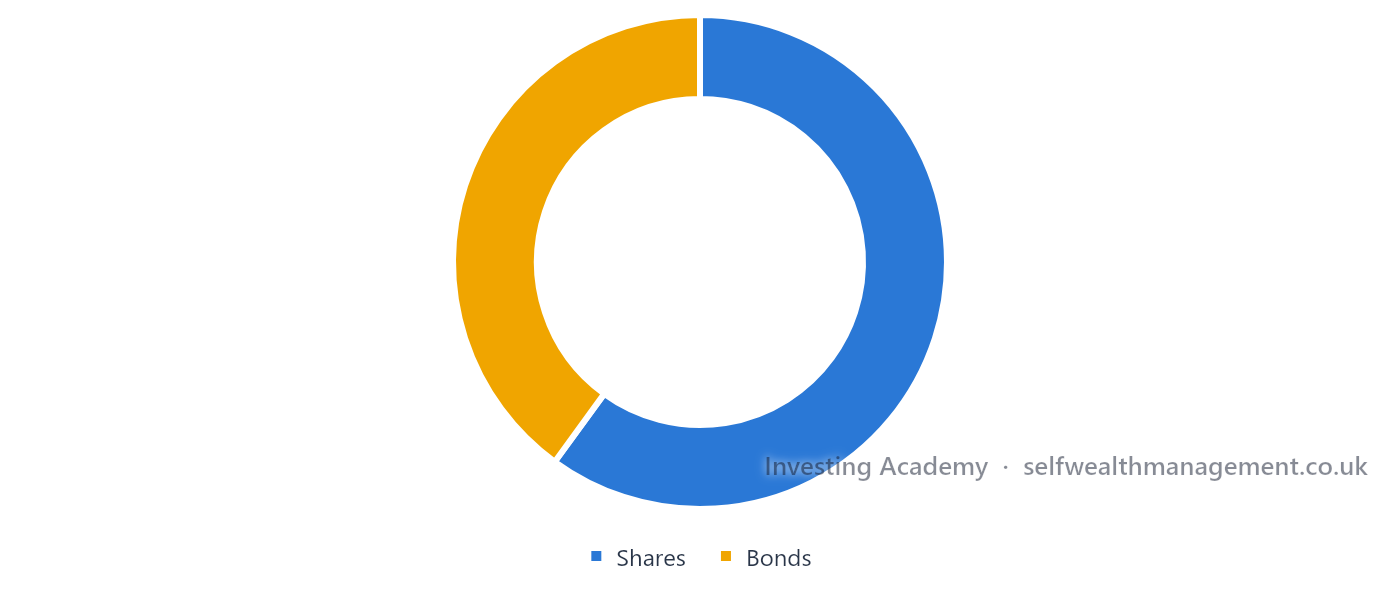
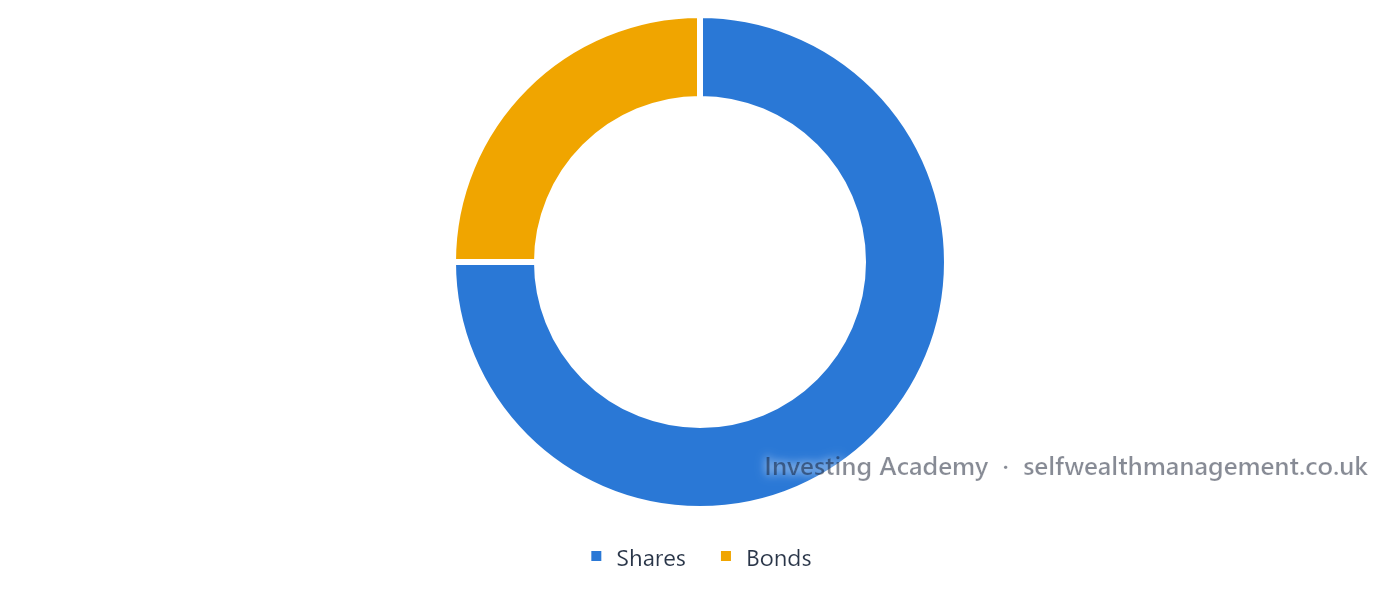
Rebalancing is sometimes described as a "buy low, sell high" discipline built directly into a portfolio — it doesn't require predicting anything, just periodically returning to your original plan.
- Rebalancing brings a portfolio back towards its intended allocation.
- Without it, a portfolio's risk profile can drift as markets move.
- It naturally involves selling recent winners and buying recent underperformers.
- It has historically helped investors maintain a consistent level of risk over time.
Educational disclaimer: This information is for educational purposes only and should not be considered financial advice or a recommendation. Investments can fall as well as rise in value, and you may get back less than you invest. Past performance is not a reliable indicator of future results.
Currency Risk
When exchange rates move, your returns can change — even if the underlying investment hasn't.
Most global funds own companies in many currencies — US Dollars, Euros, Japanese Yen, Swiss Francs. When exchange rates move, investment returns can change, even if the companies themselves haven't.
Example
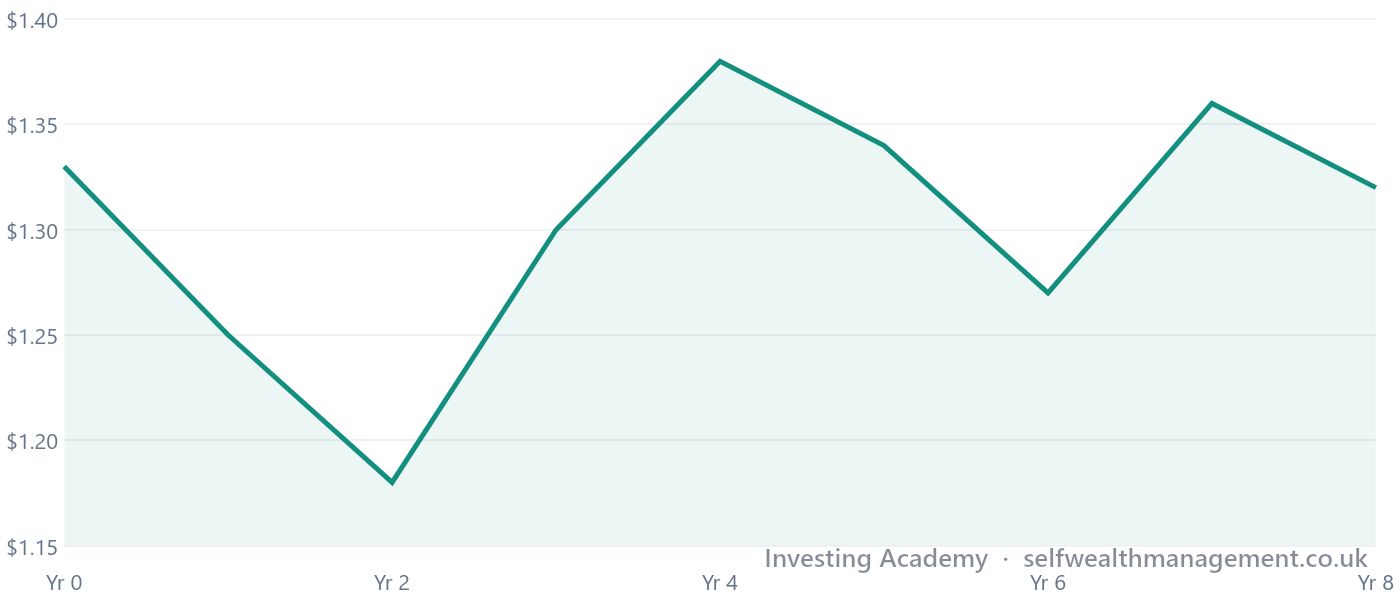
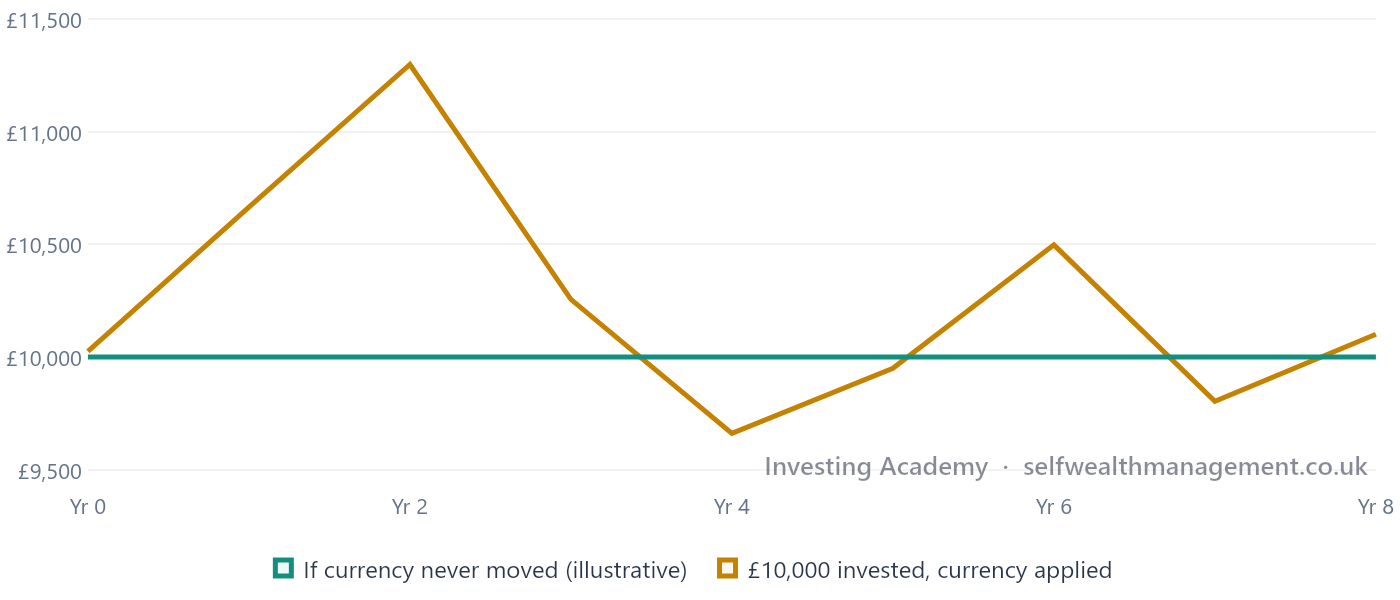
Imagine Apple's share price doesn't move at all. If the Pound strengthens significantly against the Dollar, your investment could still fall in value in Sterling. Nothing changed about Apple. The currency changed.
The two charts below tell that story in two steps. The first shows an illustrative path for the GBP/USD exchange rate over a few years. The second shows what that same path does to a UK investor's return, even though the underlying US share price never moves.
Key point
Currency movements create short-term noise. For long-term global equity investors, history suggests company growth has generally been a much larger driver of returns than currency movements — although currency can meaningfully affect returns over shorter periods.
On 16 September 1992, the UK was forced out of the European Exchange Rate Mechanism after failing to keep the Pound above its agreed floor. Sterling fell sharply against other major currencies in a single day.
What can we learn? Currency movements can be sudden and dramatic, and they can affect returns independently of how any underlying investment is actually performing.
- Global funds are exposed to multiple currencies.
- Exchange rate movements can affect returns even when share prices don't move.
- Currency effects tend to create short-term noise more than long-term direction.
- Over the long term, company growth has generally driven a larger share of global equity returns than currency.
Educational disclaimer: This information is for educational purposes only and should not be considered financial advice or a recommendation. Investments can fall as well as rise in value, and you may get back less than you invest. Past performance is not a reliable indicator of future results.
Market Valuations
Valuation explains what future returns might reasonably look like — it doesn't tell you what happens next month.
People often ask: "Is the market expensive?" Sometimes it is. Sometimes it isn't.
Valuation isn't timing
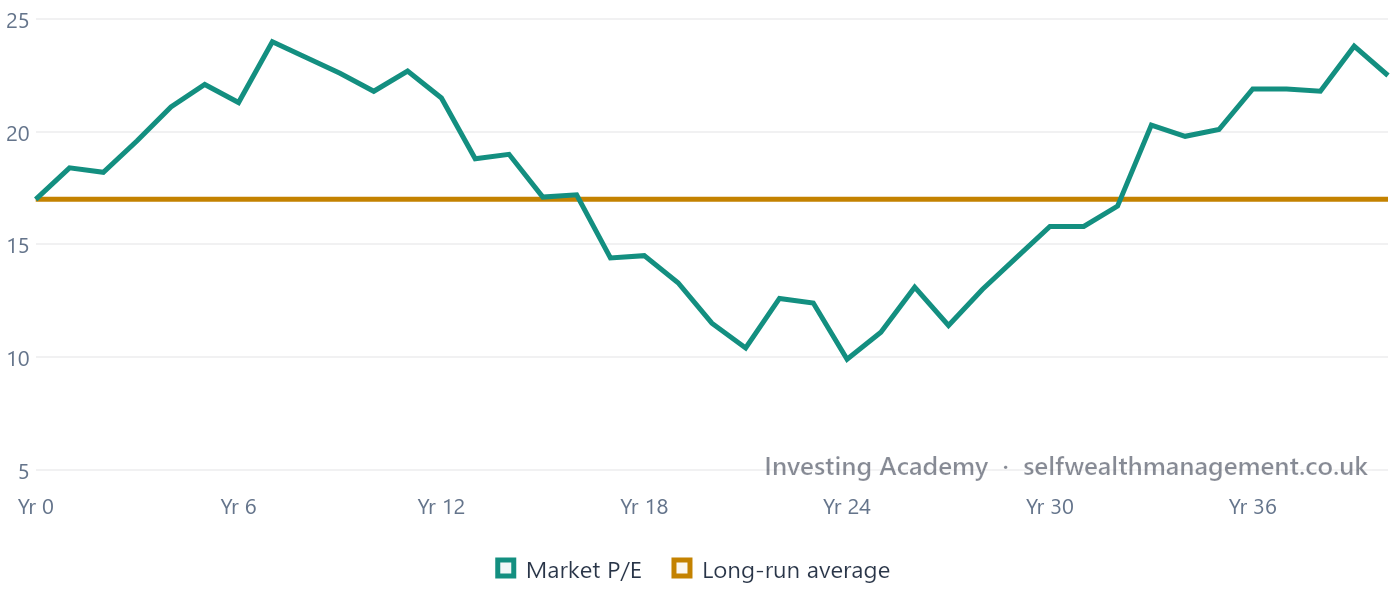
A market can remain expensive for years. Likewise, a cheap market can remain cheap. Valuation helps explain future expected returns over long periods — it doesn't tell us what markets will do next month.
Two simple measures
- P/E Ratio — compares a company's (or market's) share price to its profits. A higher P/E can mean investors expect stronger future growth, or that the market is more expensive relative to current profits.
- CAPE Ratio — a variation that smooths profits over ten years, aiming to reduce distortion from short-term profit swings.
- Valuation measures how a market is priced relative to profits.
- A market can stay expensive or cheap for a long time.
- Valuation is more useful for long-term expectations than short-term timing.
- P/E and CAPE ratios are two commonly used, simple valuation measures.
Educational disclaimer: This information is for educational purposes only and should not be considered financial advice or a recommendation. Investments can fall as well as rise in value, and you may get back less than you invest. Past performance is not a reliable indicator of future results.
Investment Bubbles
Every generation believes 'this time is different' — history says otherwise.
Every generation believes: "This time is different." History says otherwise. Tulips. Railways. Dot-com. Housing. Crypto. Artificial Intelligence? Nobody knows.
What happens in a bubble
Prices become disconnected from fundamentals. Excitement, momentum and fear of missing out can push prices well beyond what a company's or asset's underlying value would suggest. Eventually, reality catches up.
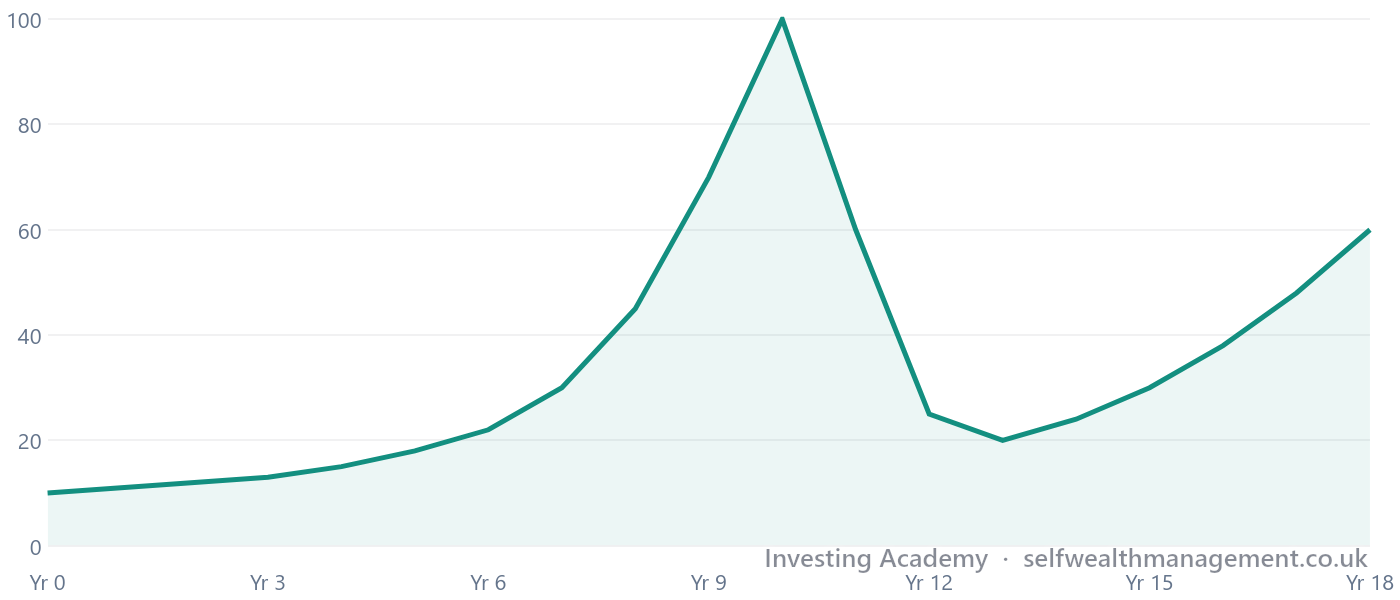
Believing "this time is different" when a popular investment's price has detached from its underlying fundamentals. Every generation has had its own version of this story — tulips, railways, dot-com shares, housing, crypto.
- Investment bubbles have recurred throughout history, across many different assets.
- Bubbles are typically driven by prices detaching from underlying fundamentals.
- Excitement and fear of missing out can accelerate a bubble's rise.
- Eventually, prices have historically returned towards fundamentals.
Educational disclaimer: This information is for educational purposes only and should not be considered financial advice or a recommendation. Investments can fall as well as rise in value, and you may get back less than you invest. Past performance is not a reliable indicator of future results.
Home Bias
UK investors often overweight UK shares — even though the UK represents a small slice of the global market.
British investors naturally love British companies. Americans love US companies. Japanese investors love Japanese companies. That's called home bias.
Yet the UK represents only around 3–4% of global equity markets. Owning only UK shares means ignoring most of the world's investment opportunities.
Why home bias happens
Home bias is a natural, well-documented behaviour — familiar companies and brands feel safer, even when they aren't necessarily lower risk. It can also stem from simply not realising how small a slice of the global market one's home country represents.
Why it's worth being aware of it
Concentrating investments in a single country means being more exposed to that country's specific economic conditions, currency, and market performance — reducing the diversification benefits available from investing more globally.
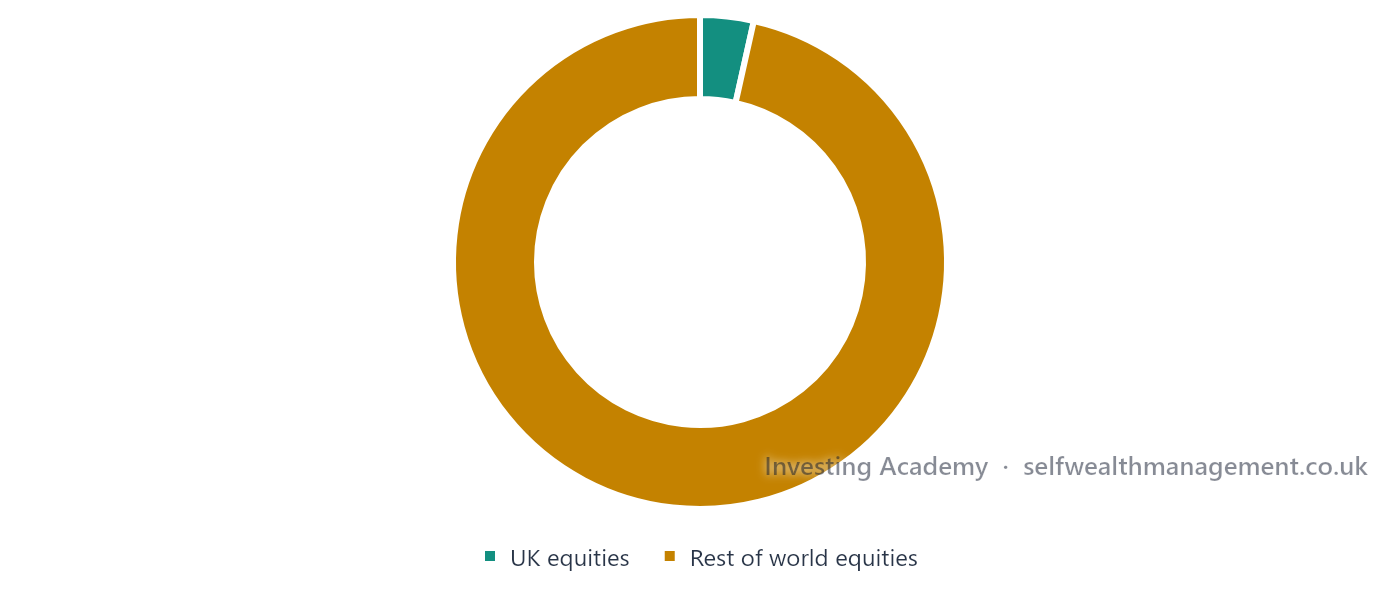
Japanese equities became one of the world's most expensive markets during the late 1980s. After the bubble burst, the Japanese stock market took decades to recover its previous peak.
What can we learn? No individual country outperforms forever. Diversification helps reduce reliance on any single market.
- Home bias means favouring domestic investments beyond what diversification would suggest.
- The UK represents only a small fraction of global equity markets.
- Home bias can increase reliance on a single country's economic performance.
- Global diversification can reduce this concentration.
Educational disclaimer: This information is for educational purposes only and should not be considered financial advice or a recommendation. Investments can fall as well as rise in value, and you may get back less than you invest. Past performance is not a reliable indicator of future results.
Inflation: The Silent Wealth Killer
Nominal returns tell you how much your money grew. Real returns tell you how much richer you actually became.
This chapter expands on our earlier introduction to inflation, looking more closely at real returns, nominal returns, and purchasing power.
Nominal vs real returns
Nominal returns are the headline number — how much an investment grew, before accounting for inflation. Real returns subtract inflation, showing how much purchasing power actually increased. A 6% nominal return during a year of 4% inflation is closer to a 2% real return — the difference between the two can be significant over long periods.
Watching £100,000 erode
£100,000 held for 30 years, doing nothing, will still show £100,000 on a statement. But its real purchasing power depends entirely on inflation over that period.
| Inflation Rate | Real Value of £100,000 After 30 Years |
|---|---|
| 2% | ~£55,000 |
| 3% | ~£41,000 |
| 5% | ~£23,000 |
Illustrative purchasing-power estimates, rounded.
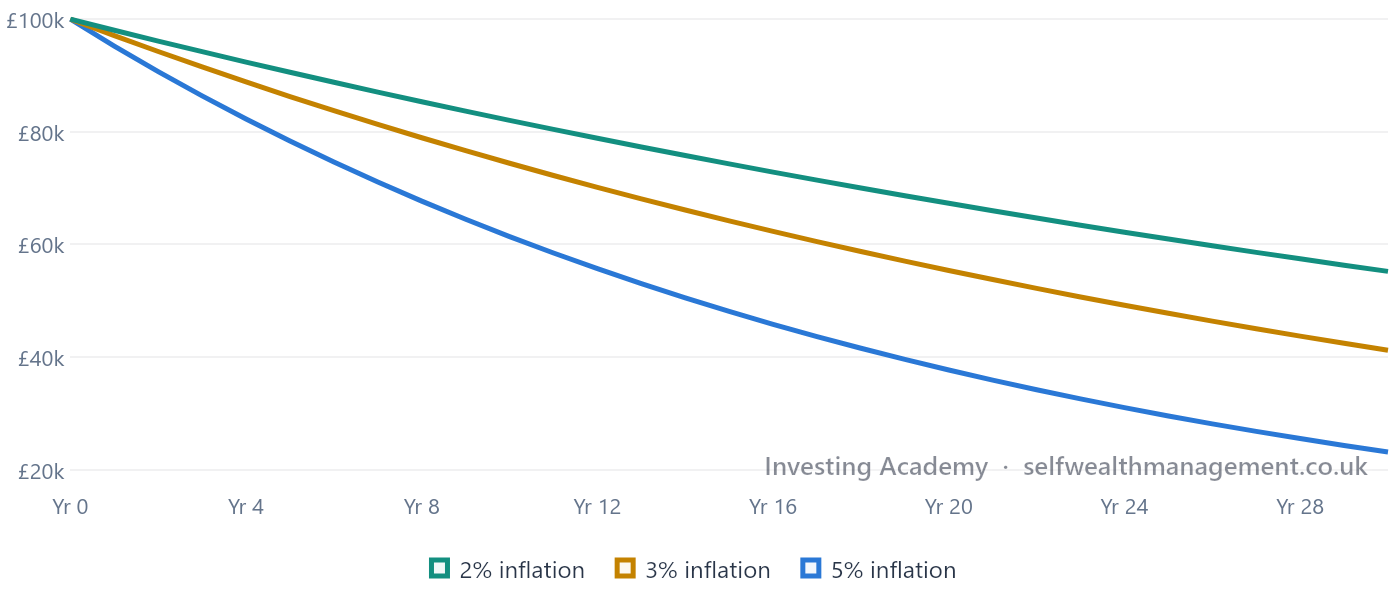
Ignoring inflation when planning retirement income. A £30,000-a-year lifestyle today will cost significantly more in 20 or 30 years' time — plans that don't account for this can fall short later in retirement.
- Nominal returns don't account for inflation; real returns do.
- The gap between nominal and real returns compounds significantly over decades.
- A stable cash balance can still lose substantial purchasing power over time.
- Ignoring inflation is a common and costly retirement planning mistake.
Educational disclaimer: This information is for educational purposes only and should not be considered financial advice or a recommendation. Investments can fall as well as rise in value, and you may get back less than you invest. Past performance is not a reliable indicator of future results.
Why Diversification Sometimes Feels Like It's Not Working
If everything in your portfolio is doing brilliantly at once, you probably aren't as diversified as you think.
True diversification means always having to say you're sorry. One investment is always disappointing. Always. That's diversification.
If everything in your portfolio was doing brilliantly, you probably weren't diversified.
Why this feels uncomfortable
It's natural to look at a diversified portfolio and notice the one holding that's lagging behind. That feeling — "why do I own this, it's dragging everything down" — is a normal, expected part of diversification, not a sign it's failing.
The trade-off diversification makes
A concentrated portfolio can outperform a diversified one in any given year, purely by chance. It can also underperform dramatically. Diversification deliberately gives up the chance of extreme outperformance in exchange for reducing the chance of extreme underperformance.
- A diversified portfolio will almost always contain a disappointing holding.
- This is normal, expected behaviour — not a sign of failure.
- Diversification trades away extreme outperformance to reduce extreme underperformance.
- Judging diversification by its single best or worst holding misses the point.
Educational disclaimer: This information is for educational purposes only and should not be considered financial advice or a recommendation. Investments can fall as well as rise in value, and you may get back less than you invest. Past performance is not a reliable indicator of future results.
The Biggest Investment Mistakes
Successful investing isn't about making lots of brilliant decisions — it's about avoiding a handful of really bad ones.
We finish the Academy with behavioural finance — the mistakes that have historically done the most damage to long-term investors, far more often than picking the "wrong" investment.
The most common mistakes
- Trying to time markets.
- Chasing recent performance.
- Watching the news too much.
- Checking portfolios daily.
- Investing without an emergency fund.
- Holding too much cash forever.
- Holding too little cash before retirement.
- Ignoring inflation.
- Paying unnecessary fees.
- Following social media "experts".
Which single habit has historically been linked to worse investor outcomes: checking a portfolio daily, or checking it twice a year?
- Successful investing isn't about making lots of brilliant decisions.
- It's about avoiding a handful of really bad ones.
- Most of the biggest mistakes are behavioural, not technical.
- Awareness of these patterns is often the first step to avoiding them.
Educational disclaimer: This information is for educational purposes only and should not be considered financial advice or a recommendation. Investments can fall as well as rise in value, and you may get back less than you invest. Past performance is not a reliable indicator of future results.